Earnings Forecast
Over the long term, corporate earnings are a principal driver of stock valuations. Operating earnings, more than as-reported (Generally Accepted Accounting Principles) earnings, convey prospects for future earnings. Therefore, aggregate S&P 500 operating earnings are a critical input for both the Real Earnings Yield (REY) Model and the Reversion-to-Value (RTV) Model of the U.S. stock market.
For several years, these models used publicly available aggregate S&P 500 earnings forecasts from Standard and Poor’s and Reuters (prior to their merger with Thomson Corporation). As described in “Quarterly Aggregate Earnings Estimate Evolutions”, these forecasts have often been highly variable and substantially inaccurate. The underlying methodologies may incorporate too much trend following and not enough mean reversion. They may also incorporate known analyst biases (see the list below for supporting research). As an alternative, the following discussion provides the CXO Advisory Group LLC forecast for aggregate S&P 500 operating earnings for the next 12 months, along with a description of the technical model used to develop the forecast.
We update this forecast as new actual aggregate quarterly earnings data become available.
See the Fundamental Valuation category for research on the usefulness of operating earnings versus other accounting measures (such as cash flows), and actuals versus estimates, as stock valuation drivers.
Forecast – Methodology – Backtest – Earnings Biases
FORECAST
The forecast for S&P 500 aggregate operating earnings over the next 12 months (through the fourth quarter of 2015) is $118.93.
Since the fourth quarter of 1988, the average quarterly forecast error is -2.1% and the standard deviation of forecast errors is 17.7% (pretty large).
METHODOLOGY
We rely on simple technical analysis to forecast aggregate earnings, meaning that we base the forecast only on historical aggregate S&P 500 operating earnings data and not on any fundamental economic data such as trends in employment or gross domestic product. Key guiding beliefs for this analysis are:
- Corporate earnings exhibit short-term momentum. See the “Momentum a Big Mistake?” for supporting research.
- Corporate earnings exhibit reversion to a secular growth rate. The further earnings have deviated from this baseline growth rate, the stronger the tendency to revert. Reversions from peaks are typically faster/sharper than reversions from troughs. See the blog entries of “Mean Reversion in Corporate Profitability” and “Aggregate Earnings and Stock Market Returns” for supporting research.
Relevant to the first belief, we hypothesize that the quarterly changes in annual earnings (momentum) over the last two quarters have some ability to predict future quarterly changes in earnings.
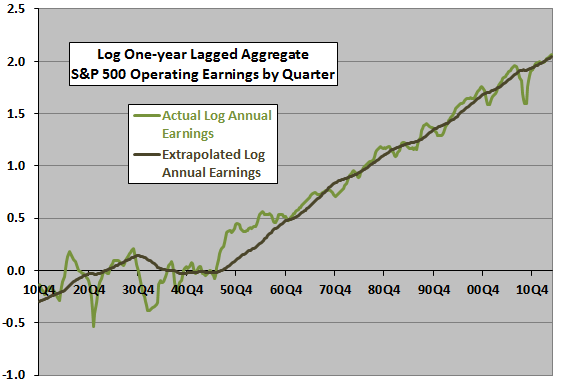
Relevant to the second belief, the following chart plots the log of actual trailing annual aggregate S&P 500 earnings by quarter, as tabulated by Robert Shiller and byStandard and Poor’s (with the former dovetailed to the operating earnings tabulation of the latter at the end of 1988), from the end of 1910 through the first quarter of 2014 (103 years). We assume these two datasets are compatible for the purpose of calculating an earnings growth rate. We assume that earnings become “actual” for a quarter as reporting of the S&P 500 companies reaches about 50% according to Standard & Poor’s. The chart also shows an earnings growth trend line generated by a rolling linear extrapolation of log earnings for the immediately preceding 40 years. Since about 1960, this rolling extrapolation produces a good trend line for actual log earnings. Based on the beliefs and research noted above, we hypothesize that deviations of actual earnings from the modeled trend line has some ability to predict future changes in earnings.
Momentum and reversion sometimes reinforce (for example, earnings growing and below trend) and sometimes oppose (for example, earnings growing and above trend).
We generate error statistics for the earnings forecasts by applying this methodology to each quarter since the fourth quarter of 1988 (the earliest from the Standard and Poor’s data) and calculating the average and the standard deviation of the percentage differences between forecasted earnings and actual earnings.
BACKTEST
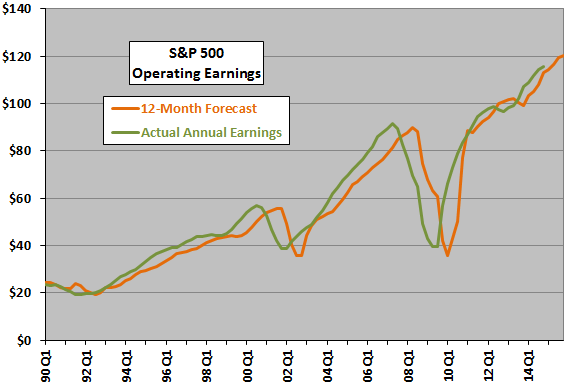
The following chart compares the forecasted and actual annual S&P 500 operating earnings on a log scale since the beginning of 1990. As tends to be the case with forecasts based on historical data, the forecasts lag actual turning points.
Based on data since the fourth quarter of 1988, the average forecast error is -2.1% and the standard deviation of forecast errors is a fairly large 17.7%. However, these error statistics are noticeably better than those derived from assuming that:
- Earnings the next 12 months will be the same as those for the preceding 12 months (average forecast error -3.7% and standard deviation of forecast errors 21.7%).
- Earnings the next 12 months will be the earnings the last 12 months plus an increment based on the contemporaneous long-term trend as depicted above (average forecast error +1.5% and standard deviation of forecast errors 23.7%).
EARNINGS BIASES
The research listed below describes biases that may taint actual and forecasted corporate earnings.
“CFO Insights on Earnings Manipulation Red Flags”, measuring the indications and prevalence of earnings manipulation among public companies.
“Prevalence and Indicators of Earnings Manipulation”, examining the degree to which management manipulates actual earnings.
“Weak Guidance vs. Beating Consensus”, comparing the effects of new guidance and actual earnings.
“Predictive Power of Aggregate Versus Firm-specific Earnings”, for an analysis of the predictive power of aggregate earnings for stock market valuation.
“Quarterly Aggregate Earnings Estimate Evolutions”, for a visualization of how S&P 500 aggregate quarterly operating earnings forecasts evolve from initiation through earnings season.
“Perspectives on Earnings Growth Forecasts”, for perspectives on the valuation implications and sustainability of earnings growth.
“Regulations Suppressing Analysts’ Earnings Optimism?”, for a study of the impacts of Regulation FD and the Global Analyst Research Settlements on sell-side analyst earnings forecasts.
“Comprehensive Overview of Research on Equity Analyst Forecasting”, for a comprehensive and organized overview of past research on equity analyst inputs, processing and outputs.
“Conservatism Bias in Earnings Forecasts”, on the conservatism bias of investors with respect to both downside and upside extremes.
“The Quarterly Earnings Forecast Walk-Down”, on the tendency of earnings forecasts to shift from optimistic to pessimistic across reporting periods as release of actuals draws near;
“Any Holes in SOX?”, regarding the effects of the 2002 Sarbanes-Oxley Act (SOX) on management-analyst earnings dynamics;
“Regulation FD: Have Some Big Shots Lost Their Privileges?”, for evidence that Regulation FD has leveled the playing field for analysts at large and small firms;
“Brokerage Business Biases Analysts”, regarding the earnings estimate biases of analysts who work for brokers;
“Earnings Guidance Lags the Market?”, summarizing patterns and informativeness of management earnings guidance;
“Uncertainty and Analyst Underreaction”, on the tendency of analysts to underreact to good company news when revising their earnings forecasts; and,
“Regulation FD is Working?”, regarding the effect of Regulation FD in making analyst earnings forecasts less accurate.