Is chasing returns a bet on rational analysis or investor overreaction? In the June 2009 version of their paper entitled “Myopic Extrapolation, Price Momentum, and Price Reversal”, Long Chen, Claudia Moise and Xinlei Zhao compare expected and actual momentum returns and explore the detailed relationship between momentum/reversal returns and firm fundamentals. Using monthly stock return data and associated fundamentals for a broad sample of firms spanning 1985-2006, they conclude that:
- There is a pattern from short-term momentum to long-term reversal in firm fundamentals that roughly matches observed stock price momentum and reversal. Past winners experience more positive earnings shocks than past losers temporarily during the six to nine months after sorting, when momentum profits peak. After nine months, winners persistently experience more negative earnings shocks than losers.
- Analysts tend to revise both near-term and long-term earnings and cash flow forecasts following this same pattern, reacting to contemporaneous earnings shocks and ignoring predictable long-term earnings reversion.
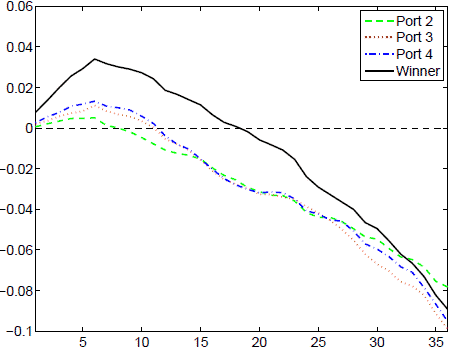
- Investors likewise drive prices of past winners (losers) up (down) temporarily and then down (up) over the long term. (See the first chart below.)
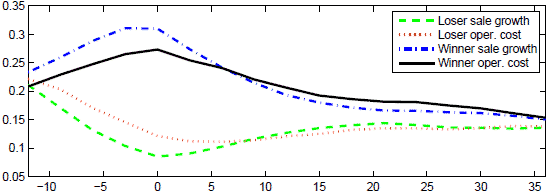
- After accounting for predictable long-term reversion, past winners actually have significantly lower expected returns than past losers. Momentum pricing is therefore an “error” derived from myopic overweighting of contemporaneous earnings. (See the second chart below.)
- Institutional investors tend to time their holdings well to with respect to near-term momentum and long-term reversal. Individual investors do not, thereby transferring wealth to institutional investors.
The following chart, taken from the paper, plots the cumulative excess return over the Loser Portfolio (bottom fifth) for each of four other portfolios during the 36 months after portfolio formation (time 0). Ranking of the the five portfolios at time 0 is based on past returns from month -12 through month -2 (followed by a skip month). Cumulative excess returns peak at six to nine months and increase systematically with past returns. Excess returns then decline steadily, turning negative for Winner minus Loser at about 18 months. After 36 months, excess returns reach -8% to -10% for all four cases.

The next chart, also from the paper, compares percentage year-over-year quarterly sales growth and operating cost growth (before depreciation) for the Winner and Loser portfolios from 12 months before to 36 months after portfolio formation (time 0). For the year before portfolio formation, the growth rate in sales is greater (less) than the growth rate of operating costs for past winners (losers). These conditions persist for about two quarters after portfolio formation, at which point the sales growth-operating cost growth relationships reverse for both past winners and past losers. In other words, profitability of past winners (losers) increases (decreases) for about six months after portfolio formation and then decreases (increases) for many months thereafter.

In summary, evidence indicates that investors and analysts tend to extrapolate current earnings shocks and discount their predictable reversion. This shortsightedness manifests as the momentum effect, reflected in both stock prices and analyst cash flow forecasts.