Real Earnings Yield (REY) Model
Do investors require a predictably substantial expected stock market real earnings yield (aggregate expected corporate operating earnings minus the expected inflation over the next 12 months, divided by stock index level)? In other words, when the forward real earnings yield is relatively high (low), do they bid stock prices up (down) to restore a normal gap between forward earnings yield and expected inflation. To investigate whether such a Real Earnings Yield (REY) model works, we relate the combined evolution of an operating earnings forecast for the S&P 500 and an inflation forecast to the behavior of the S&P 500 Index. To convert from the quarterly earnings cycle to a monthly frequency, we assume 50% / 40% / 10% of new earnings data for a quarter becomes known during the first / second / third month after quarter end. Availability of S&P 500 lagged (trailing 12 month) operating earnings from Standard and Poor’s as an earnings forecast input limits the sample period. Using monthly earnings forecast and S&P 500 Index data during March 1989 through December 2014, we find that:
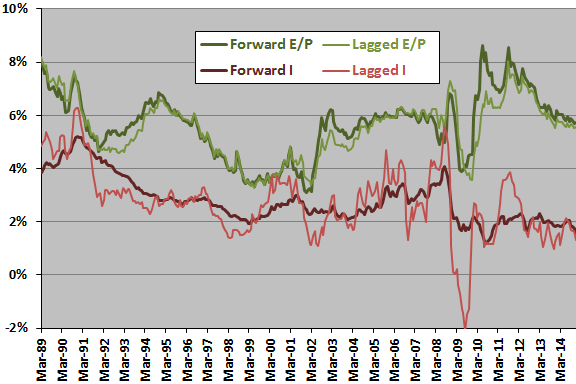
The following chart shows the gap between the S&P 500 forward earnings yield and the forward total inflation rate over the available sample period. For reference, it also shows the S&P 500 lagged earnings yield and the lagged total inflation rate. The gap between forward earnings yield and forward total inflation rate is the S&P 500 forward real earnings yield. The average forward real earnings yield over the entire sample period is 2.86%, with monthly standard deviation 1.38%.
How does the forward real earnings yield relate to S&P 500 Index behavior?
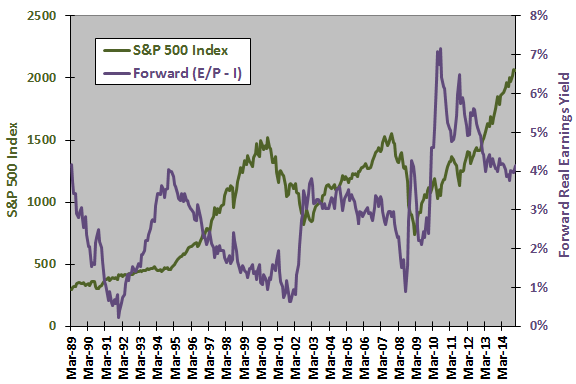
The next chart compares the behaviors of the S&P 500 Index and the S&P 500 forward real earnings yield over the available sample period. Visual inspection suggests some tendency for the stock market to be relatively strong (weak) after the forward real earnings yield is high (low).
For precision, we relate the forward real earnings yield to stock market returns over fixed future intervals.
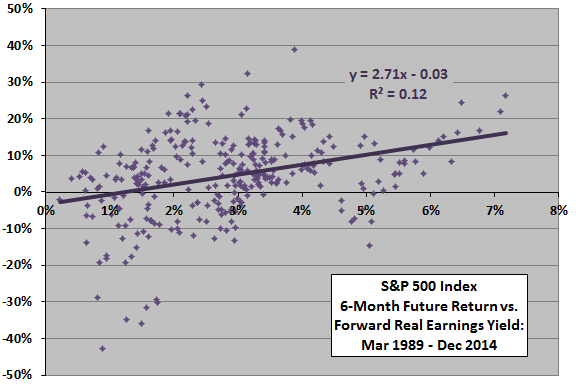
The following scatter plot relates the 6-month future return for the S&P 500 Index to the forward real earnings yield over the available sample period. The Pearson correlation between the two series is 0.34 and the R-squared statistic is 0.12, indicating that the forward real earnings yield explains 12% of the variation in the 6-month future return. The positive slope indicates that future stock market returns tend to be higher (lower) when the forward real earnings yield is relatively high (low).
Because the future return measurement interval (six months) is longer than the sampling frequency (monthly), the number of points on the scatter plot overstates effective sample size. Also, overlap of measurement intervals may distort statistics.
For a future return measurement interval of three months, the Pearson correlation is 0.24 and the R-squared statistic is 0.06.
To investigate non-linearities, we calculate average future returns by ranges of the forward real earnings yield.
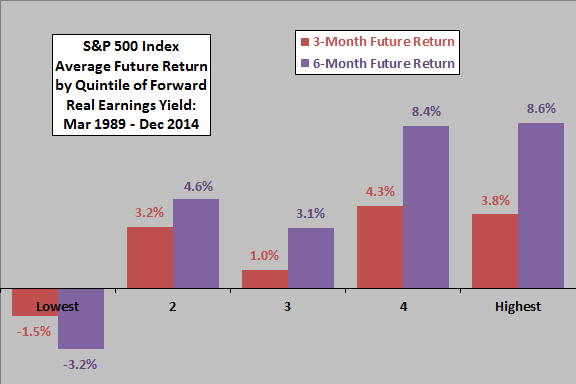
The next chart summarizes the average 3-month and 6-month future returns for the S&P 500 Index by quintile of forward real earnings yield over the available sample period. For both future return intervals, average returns generally increase across forward real earnings yield quintiles. Any lack of consistency is cautionary regarding model reliability.
There are 61-62 observations per quintile, but overlap in return measurement intervals makes the sample very small for a quintile breakdown.
As a robustness test, we look at two subperiods.
The Pearson correlations for the relationship between the 6-month future return for the S&P 500 Index and the forward real earnings yield over two equal subperiods (March 1989 through January 2002 and February 2002 through December 2014) are 0.41 and 0.51, indicating consistency in the relationship over time. The overall sample period is very short (compared to return intervals) for subperiod tests.
The (messy) linear relationship implied by the scatter plot above offers a way to estimate S&P 500 Index future returns. For example, based on data available through December 2014, the slope and y-intercept for the relationship between the S&P 500 Index 6-month future return and the forward real earnings yield are 2.71 and -0.034, respectively. The forward earnings yield as of the end of December 2014 is about 4.14%. The projected return for the S&P 500 Index from the end of December 2014 through the end of June 2015 is therefore 2.71 * 4.14% – 3.4% = +7.6%.
A similar calculation for a 3-month horizon indicates a return of +3.8% from the end of December 2014 through the end of March 2015.
See Market Models for a summary of current stock market projections.
Note that the fairly wide dispersion of data points around the best-fit line in the above scatter plot indicates considerable variability in actual future returns. What might drive the dispersion? Possibilities include:
- Investors may employ methods of estimating forward earnings and forward inflation rate that differ materially from the Earnings Forecast and Inflation Forecast used here.
- The U.S. stock market is not a closed system. Other, substantially uncorrelated real earnings yields may compete.
- Decision factors other than real earnings yield may be important to investors.
- There may be considerable randomness in market behavior.
In summary, the REY Model appears to offer some information about S&P 500 Index returns over the next one or two quarters.
Some additional cautions regarding this conclusion are:
- As noted above, the effective sample size is fairly small for the tests employed, and overlap of measurement intervals may distort statistics.
- The available sample period may not be representative of the long-term relationship between S&P 500 Index future returns and the forward earnings yield.
- Non-normality of the stock market returns disrupts interpretation of “normal” statistics.
The REY model is kin to the Fed Model, but uses the expected inflation rate (a wealth discount rate) rather than Treasury instrument yields (competitors to stocks) as a benchmark for the expected stock market earnings yield. Research covered in Fundamental Valuation and Economic Indicators offers other perspectives on earnings-inflation rate valuation approaches.