Do earnings forecasts contain information that investors can exploit to generate abnormal stock returns, or does the market efficiently discount these forecasts? In the November 2006 version of their paper entitled “Forecasted Earnings per Share and the Cross Section of Expected Stock Returns”, Ling Cen, John Wei and Jie Zhang investigate whether stocks with high forecasted earnings per share (FEPS) substantially outperform those with low forecasts, after controlling for commonly used risk factors. Using data for a large sample of NYSE, AMEX and Nasdaq-listed common stocks for the period January 1983 through December 2005 (712,563 stock-month observations), they conclude that:
- A strategy of buying (selling) the tenth of stocks with the highest (lowest) FEPS generates a raw return of 1.2% per month. This return spread decreases modestly to 0.88% per month after accounting for market risk (beta) and for value, size and momentum effects.
- About two-thirds of the abnormal returns of the hedged FEPS strategy come from the short side of the trade (declines in low-FEPS stocks) and one-third comes from the long side (advances in high-FEPS stocks).
- FEPS strategy abnormal returns concentrate in three-day windows around future earnings announcements.
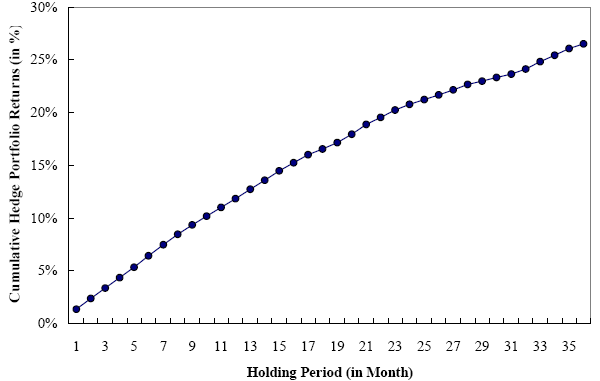
- FEPS predicts diminishing abnormal returns for up to three years.
- The FEPS effect is strongest for firms with small market capitalization, low stock price, thin analyst coverage and poor past returns, all indicating relatively high arbitrage risk.
- High-FEPS stocks tend toward low-risk properties: low beta, high liquidity and high profitability (return on equity). In fact, the FEPS trading strategy is counter-cyclical to overall market performance.
- Results are robust across different risk-adjustment techniques, various earnings measurement approaches, subsamples and exclusion of outliers.
The following chart, taken from the paper, shows average cumulative returns for equal-weighted, zero-cost portfolios that are long the tenth of stocks with highest FEPS and short the tenth with the lowest FEPS over the period January 1983 through December 2005. Portfolios are formed monthly based on mean FEPS and held for 36 months. The chart shows that the abnormal returns grow stably and smoothly. While the rate of growth diminishes over time, there are no return reversals during the holding period.

In summary, investors systematically overvalue (undervalue) stocks when they expect earnings per share to be low (high). Their expectations exhibit conservatism bias with respect to both the downside and upside extremes.