Trading Calendar – October
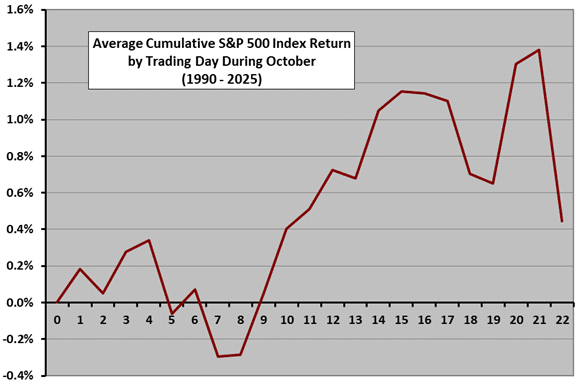
The following chart shows the average month-to-date percentage change in the S&P 500 index by trading day during October from 1990 through 2025. Day 0 represents the September close. We insert two dummy trading days after 10/26/12 with the same close as 10/26/12 to avoid calendar misalignment for the balance of the month. The chart shows that the index during October overall (greatly affected by 2008 and 2011) tends to be volatile with weakness in the first half and strength in the second half. We have not used data for trading day 23, because most Octobers do not have 23 trading days. Also, sample size is only 28-34 for specific trading days, so these results are only mildly suggestive rather than predictive. For 1990-2025, 23 Octobers have been winners and 13 losers.
Return to the Trading Calendar to find other monthly profiles.