Value Investing Strategy (Strategy Overview)
Allocations for April 2024 (Final)
Cash TLT LQD SPY
Momentum Investing Strategy (Strategy Overview)
Allocations for April 2024 (Final)
1st ETF 2nd ETF 3rd ETF
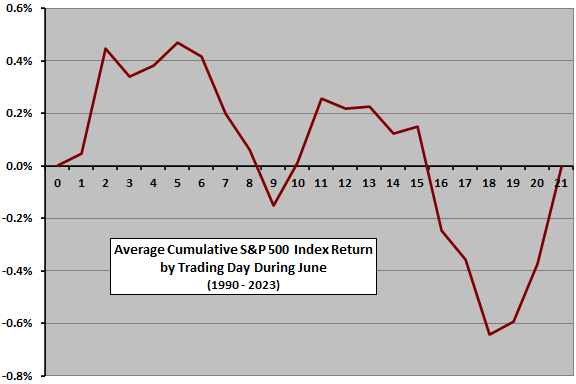
Trading Calendar – June
The following chart shows the average month-to-date percentage change in the S&P 500 index by trading day during June from 1990 through 2023. Day 0 represents the May close. It shows that the index during June tends to be about neutral, with a month-end dip. We have not used data for trading day 22, because many Junes do not have 22 trading days. Also, sample size is only 28-34 for specific trading days, so these results are only mildly suggestive rather than predictive. For 1990-2023, 20 Junes have been winners and 14 losers.
Return to the Trading Calendar to find other monthly profiles.