Does aggregate short interest serve as an intermediate-term stock market indicator based on either momentum (shorting begets shorting) or reversion (covering follows shorting)? To investigate, we relate the behavior of NYSE aggregate short interest with that of SPDR S&P 500 (SPY). Prior to September 2007, NYSE aggregate short interest is monthly (as of the middle of each month). Since September 2007, measurements are approximately biweekly (as of the middle and end of each months). There is a delay of about two weeks between short interest measurement and release, and new releases sometimes revise prior releases. Using monthly/biweekly short interest data culled from NYSE news releases and contemporaneous dividend-adjusted SPY price for the period January 2002 through February 2014 (69 monthly followed by 154 biweekly observations), we find that:
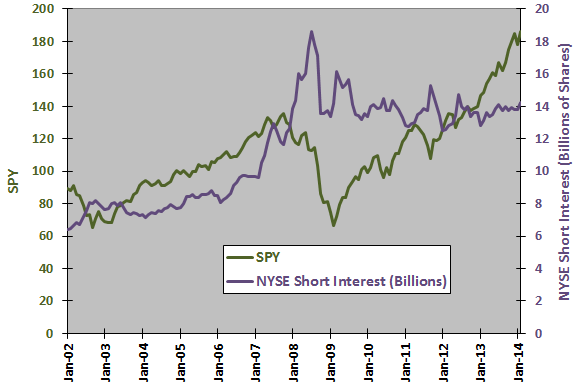
The following chart compares monthly SPY dividend-adjusted price (at ends of months, corresponding to release dates for prior-month short interest) and NYSE short interest in billions of shares over the entire sample period (146 months). Visual inspection suggests some tendency of the two series to move oppositely, but any such relationship is inconsistent.
For a closer look, we relate monthly SPY return to monthly change in short interest.
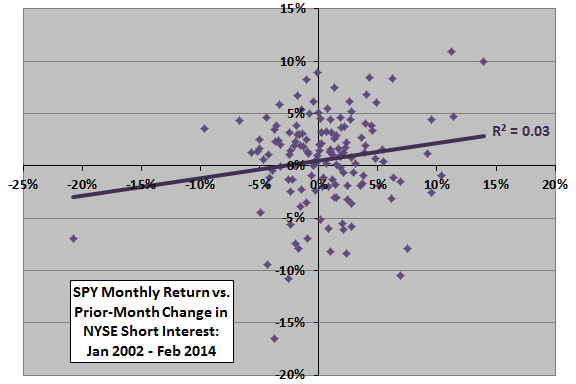
The following scatter plot relates SPY monthly return to prior-month change in NYSE aggregate short interest over the entire sample period. For example, the SPY return for February 2014 relates to the change in short interest from mid-December 2013 to mid-January 2014 as reported at the end of January 2014. The Pearson correlation for these two series is 0.16 and the R-squared statistic is 0.03, indicating that prior-month change in aggregate short interest explains 3% of the variation in monthly SPY return. The bigger the increase (decrease) in short interest, the better (worse) the future SPY return.
In case there is a material non-linearity in the relationship, we look at average monthly SPY return by range of prior-month change in aggregate short interest.
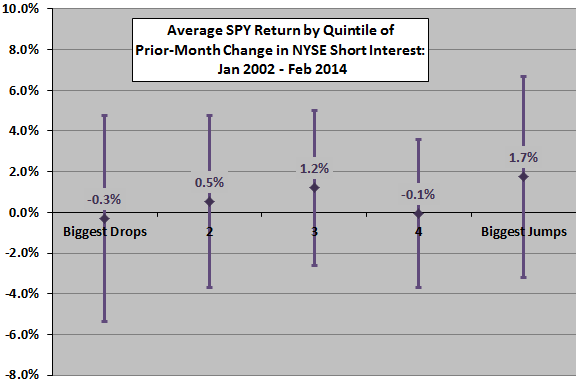
The next chart summarizes average SPY return by quintile (ranked fifth) of prior-month change in NYSE aggregate short interest over the available sample period, with one standard deviation variability ranges. There are only 28-29 observations per quintile. While the biggest jumps in short interest are much more bullish than the biggest drops, average returns do not progress systematically across quintiles.
Does change in aggregate short interest reliably lead stock market return over horizons longer than one month?
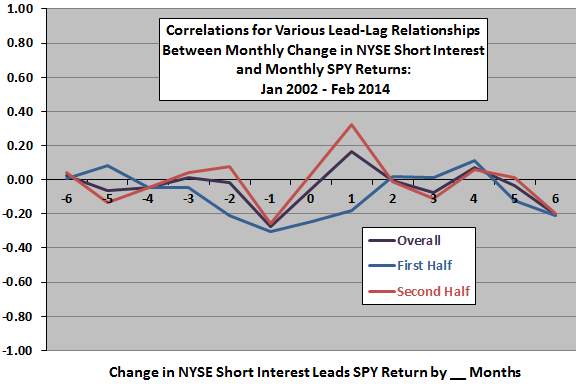
The next chart plots correlations between SPY monthly return and monthly change in NYSE aggregate short interest for lead-lag scenarios ranging from stock market return leads change in short interest by six months (-6) to change in short interest leads stock market return by six months (6) over the entire sample period and two equal subperiods.
The lead-lag relationship appears to be mostly noise. The only consistent reading is that SPY return leads change in short interest by one month (negatively, suggesting that strength/weakness in SPY leads to short covering/more shorting). The positive relationship between prior-month change in short interest and SPY return found above (at lead-lag 1) derives only from the second half of the sample period.
Both lack of systematic progression in average SPY return across quintiles of prior-month change in aggregate short interest and lack of agreement between subperiods undermine belief in a reliable relationship.
Are the more recent biweekly data more informative?
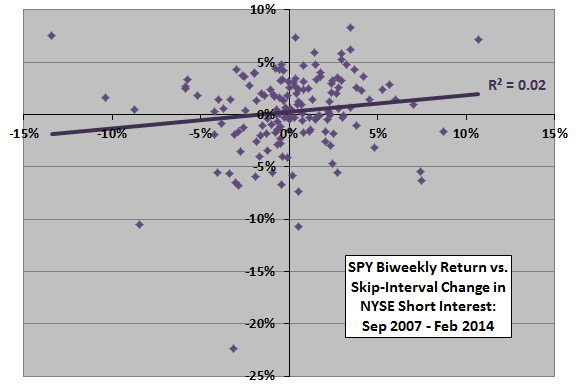
The next chart relates SPY biweekly return to skip-interval biweekly change in NYSE aggregate short interest during September 2007 through February 2014. For example, the SPY return for mid-February 2014 through the end of February 2014 relates to the change in short interest from mid-January 2014 to the end of January 2014 as reported mid-February 2014. The Pearson correlation for these two series is 0.13 and the R-squared statistic is 0.02, indicating that prior change in aggregate short interest explains just 2% of the variation in biweekly SPY return.
Excluding the October 15, 2008 return outlier at the bottom of the chart reduces the R-squared statistic to 0.01.
In case there is a material non-linearity in the relationship, we look at average biweekly SPY return by range of skip-interval change in aggregate short interest.
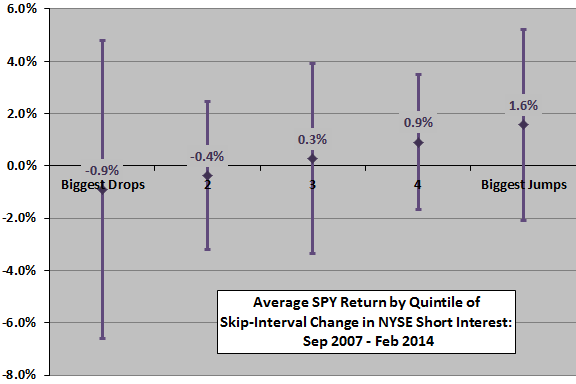
The next chart summarizes average SPY return by quintile of skip-interval change in NYSE aggregate short interest over the available sample period, with one standard deviation variability ranges. There are only 30-31 observations per quintile. For this scenario, average returns increase systematically across quintiles, boosting confidence in a reliable relationship.
Excluding the October 15, 2008 return outlier cited above increases the average return of the “Biggest Drop” quintile to from -0.9% -0.2% and substantially compresses the variability range.
Does change in aggregate short interest reliably lead stock market return over horizons longer than one skip-interval?
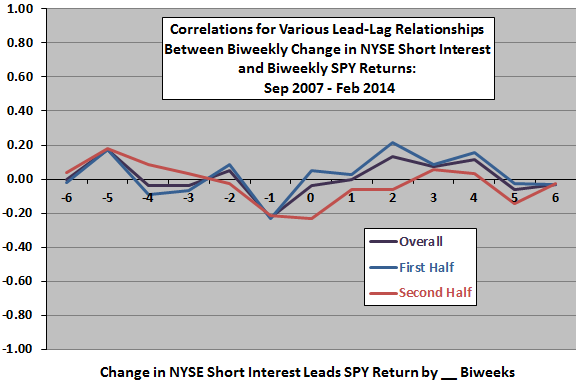
The next chart plots correlations between SPY biweekly return and biweekly change in NYSE aggregate short interest for lead-lag scenarios ranging from stock market return leads change in short interest by six biweeks (-6) to change in short interest leads stock market return by six biweeks (6) over the entire sample period and two equal subperiods.
Again, the lead-lag relationship appears to be mostly noise. The only consistent reading is that SPY return leads change in short interest by one biweek (again negatively, suggesting that strength/weakness in SPY leads to short covering/more shorting). The positive relationship between prior-month change in short interest and SPY return found above (at lead-lag 2) derives only from the first half of the sample period.
Is the lead-lag 2 indication exploitable?
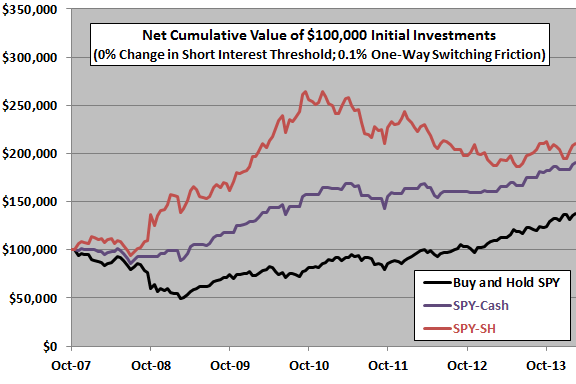
The next chart compares cumulative values of $100,000 investments initiated in mid-October 2007 in three strategies:
- Buy and Hold SPY (benchmark).
- SPY-Cash: hold SPY if the change in aggregate short interest two biweeks ago is positive, and cash if it is negative.
- SPY-SH: hold SPY if the change in aggregate short interest two biweeks ago is positive, and ProShares Short S&P500 (SH) if it is negative.
We assume return on cash is zero (approximately correct for the sample period) and one-way switching friction is 0.1%. We ignore tax implications of trading.
Both timing strategies beat buy-and-hold based on terminal value. The average biweekly return for SPY-Cash (SPY-SH) is 0.50% (0.65%), compared to 0.29% for buy-and-hold. The standard deviation of biweekly returns for SPY-Cash (SPY-SH) is 2.51% (3.88%), compared to 3.90% for buy-and-hold. Both timing strategies underperform buy-and-hold during the second half of the sample period.
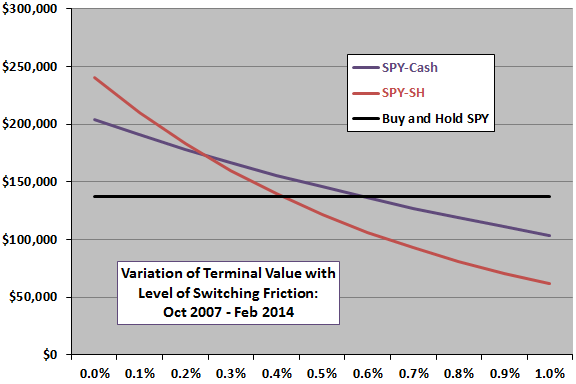
How sensitive are results to the assumed threshold for changes in short interest and level of switching friction?
The next chart compares terminal values of the three strategies for one-way switching frictions ranging from 0.0% to 1.0%. SPY-SH is the best (worst) for friction below 0.2% (above 0.4%). SPY-Cash beats buy-and-hold for friction below 0.6%. SPY-SH is more sensitive to friction than SPY-Cash because it involves twice as many one-way trades.
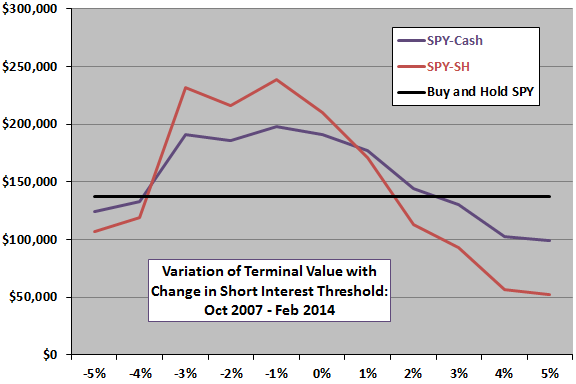
The final chart compares terminal values of the three strategies for biweekly change in aggregate short interest thresholds ranging from -5% to +5%. Results indicate that timing is effective only for thresholds in the range -3% to +1%. These results may be sample-specific.
In summary, evidence from simple tests is mixed regarding belief that changes in aggregate short interest are useful for intermediate-term stock market timing.
Cautions regarding findings include:
- The sample periods, especially for biweekly data, are short in terms of number of bull-bear market cycles.
- As noted, the power of changes in aggregate short interest to predict stock market returns is inconsistent across subperiods for both monthly and biweekly samples.
- As noted, excluding the 10/15/08 return outlier materially degrades the power of biweekly changes in aggregate short interest to predict stock market returns.
- The timing strategy is not highly robust to level of switching friction (and therefore suspect for small accounts).
- Revisions to past short interest data may be material to findings.