When the stock market close is strong (weak) relative to its daily range, does it indicate pent-up buying (selling) demand? Should one trade with or against this relative close? To investigate, we relate position of the daily close for the S&P 500 Index relative to its same-day range to future return for the index. We calculate:
- Daily range as High minus Low, divided by Open.
- Daily relative close as Close minus Low, divided by High minus Low.
Using daily open, high, low and close levels of the S&P 500 Index during 1/2/62 (the earliest with a daily range) through 3/17/20, we find that:
There are a few days in the full sample with zero ranges. We delete those days.
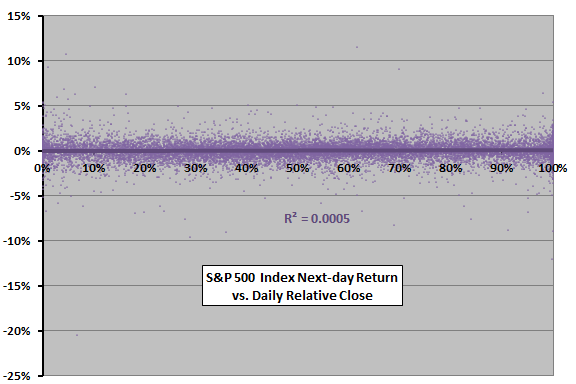
The following scatter plot relates S&P 500 Index next-day (close-to-next close) return to daily relative close over the full sample period. There is no obvious relationship between the two series. The Pearson correlation is 0.02 and the R-squared statistic is 0.0005, indicating that daily relative close has little or no power to predict next-day return.
To check for non-linearity in the relationship, we calculate average next-day returns by ranked tenth (decile) of daily relative closes.
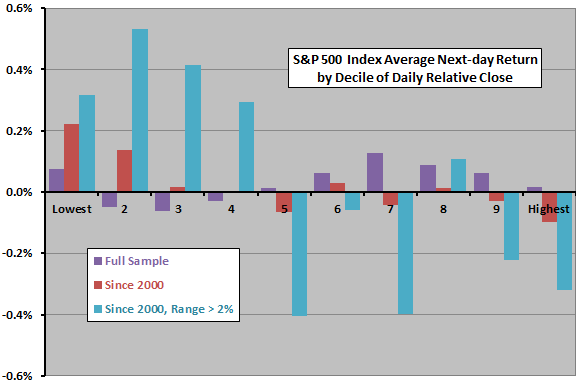
The next chart summarizes S&P 500 Index average next-day returns by decile of daily relative closes for:
- The full sample.
- Since the beginning of 2000 (because older trading behaviors may differ from current behaviors).
- Since the beginning of 2000 only for trading days with daily range at least 2% (because volatile trading may amplify effects).
For these three samples/subsamples, there are 1461, 508 and 87 observations per decile, respectively. Notable points are:
- For the full sample, results are uninteresting. Average returns across deciles are all small and exhibit no clear pattern.
- For the subsample since the beginning of 2000, there is evidence of reversion after weak relative closes. In other words, closes near the low indicate relatively high next-day returns. However, the pattern across deciles is not completely systematic, indicating material randomness.
- For the subsample of volatile days since the beginning of 2000, there is evidence of reversion after both weak and strong relative closes. However, again, the pattern across deciles is not completely systematic.
Lower deciles generally have higher standard deviations of returns than upper deciles, interfering with exploitation of weak closes.
Might average relative close over the past five or 10 trading days predict index return over the next five or 10 trading days?
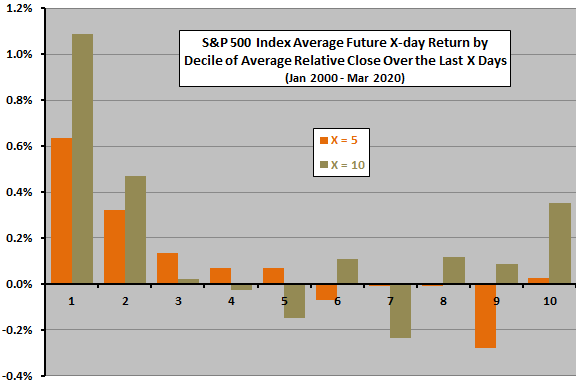
The final chart summarizes average 5-day (10-day) S&P 500 Index future returns by decile of average relative closes over the preceding five (10) trading days since the beginning of 2000. There are 507-508 observations per decile. While relationships are not completely systematic across deciles, the lowest two deciles stand out with relatively strong average future returns after weak average relative closes. However, lower deciles have higher standard deviations of returns than most upper deciles.
Note that overlap of measurement intervals may distort statistics (said differently, interfere with exploitation).
In summary, evidence from simple tests indicates that very weak daily stock market closes relative to daily ranges are bullish for near-term returns, especially when volatility is high.
Cautions regarding findings include:
- Results are in-sample, employing all sample/subsample data. Trading in real time would require defining extremely weak relative closes based on historical data only.
- Testing multiple rules/subsamples introduces data snooping bias, such that strongest results overstate expectations.
- A trader seeking to exploit the low-decile relative closes as modeled above would have to anticipate relative close by enough to trade at the close.
- Frictions from trading to exploit findings would reduce returns. Frictions tend to be elevated when volatility is high.