A reader requested confirmation of findings in the article “A Simple & Powerful Timing Indicator” of May 2009, which examines the strength of the (risky) NASDAQ Composite Index relative to the (conservative) S&P 500 Index as a market timing indicator. The article cites the book Technical Analysis – Power Tools For Active Investors (copyright 2005 and second printing date May 2005) as the source for the indicator. The indicator is the ratio of weekly index levels (risky-to-conservative) with respect to the ratio’s 10-week simple moving average (SMA). The associated trading rule is to move from cash (stocks) to stocks (cash) when the weekly ratio crosses above (below) its 10-week SMA. The hypothesis is that a stronger (weaker) risky index indicates risk-on (risk-off) sentiment and therefore a strong (weak) stock market. Using weekly closes for the S&P 500 Index, the NASDAQ Composite Index, the dividend-adjusted SPDR S&P 500 (SPY) and the 13-week Treasury bill (T-bill) yield as available from late November 1992 (based on inception of SPY) through mid-May 2016, we find that:
First, we consider the inherent predictive power of the specified index relative strength indicator.
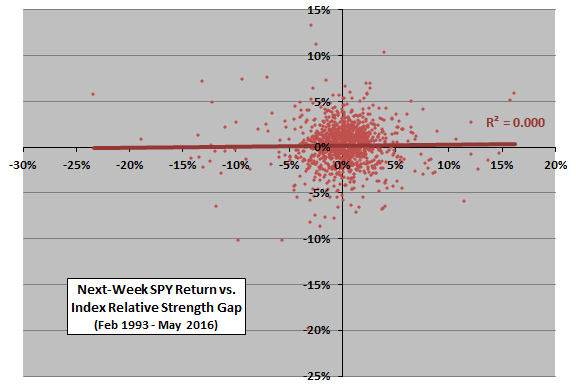
The following scatter plot relates next-week SPY return to the gap between weekly value of the NASDAQ Composite-S&P 500 ratio and its 10-week SMA (as a percentage of the ratio) over the available sample period. If the gap measures persistent investor risk appetite, the more positive (negative) the percentage gap, the stronger the good (bad) implication for future SPY return.
The Pearson correlation between the two series is 0.015, and the R-squared statistic is 0.000, indicating no useful relationship. In other words, the gap between the ratio of indexes and its 10-week SMA appears not to be useful for weekly trading of SPY. This finding does not support belief that investor risk appetite scales with relative strength of risky and conservative market indexes.
Any value of the indicator must come from a non-linear effect, which we look at next.
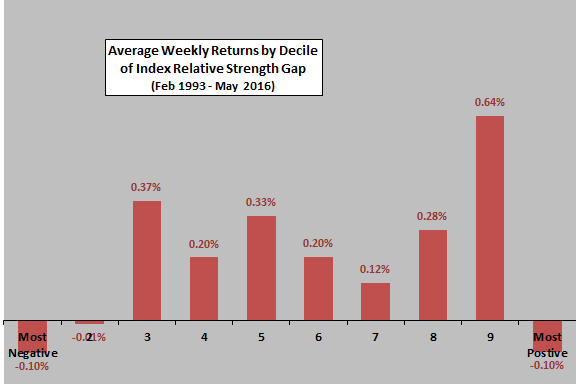
The next chart summarizes average next-week SPY return by ranked tenth (decile) of the percentage gap between NASDAQ Composite-S&P 500 ratio and its 10-week SMA over the available sample period. There is no progression of average returns across deciles.
There is perhaps a binary indication (driven by decile 9) that positive gaps beat negative gaps. In fact, the average next-week SPY return when the gap is positive (negative) is 0.28% (0.08%).
Does this binary indication translate into an attractive trading strategy?
For evaluating a strategy based on the indicator, we assume that:
- Using weekly closes, when the ratio of the NASDAQ Composite Index to the S&P 500 Index crosses above (below) its 10-week SMA, buy (sell) SPY at the same close (treating signals from just before the close as reliable).
- One-way switching friction when entering and exiting SPY is 0.1% of funds for the baseline case. Actual friction depends on specific broker fees, account size and market liquidity.
- When not in SPY, the return on cash is the T-bill yield.
- Reinvestment of quarterly SPY dividends is immediate and frictionless.
- Ignore tax implications of trading.
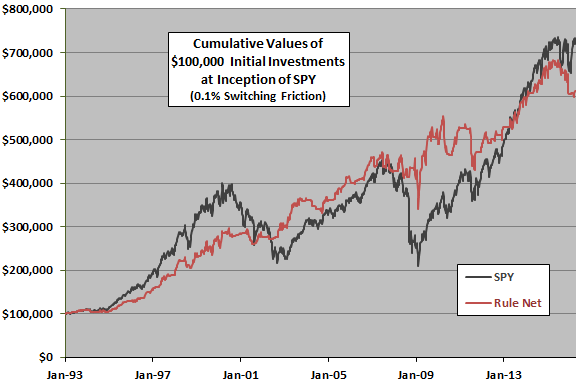
The following chart tracks cumulative values of buying and holding SPY (SPY) and applying the trading rule with 0.1% switching friction (Rule Net) over the entire sample period. Results indicate that the trading rule sometimes outperforms and sometimes underperforms buy-and-hold with lower volatility. However, its performance in recent years appears relatively unattractive.
Over the entire sample period, the compound annual growth rates (CAGR) for SPY and Rule Net are 8.9% and 8.1%, respectively. Maximum drawdowns (MaxDD) are -55% and -28%.
For another perspective, we look at average weekly returns.
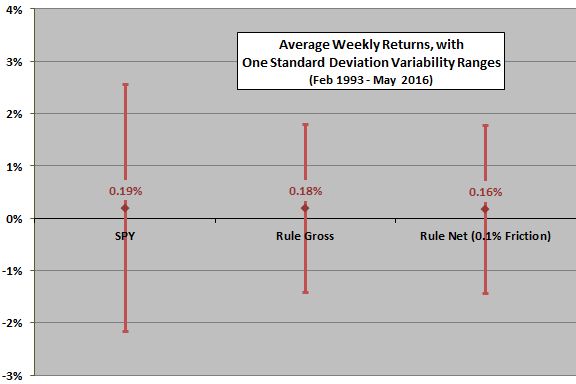
The next chart summarizes average weekly returns over the entire sample period, with one standard deviation variability ranges, for: buying and holding SPY (SPY); applying the trading rule frictionlessly (Rule Gross); and, applying the trading rule with baseline trading friction (Rule Net). Results confirm that the trading rule captures most of SPY return with substantially lower volatility.
Over this period, the trading rule generates 209 switching signals and is in stocks 57% of the time.
How sensitive is outcome to level of trading friction?
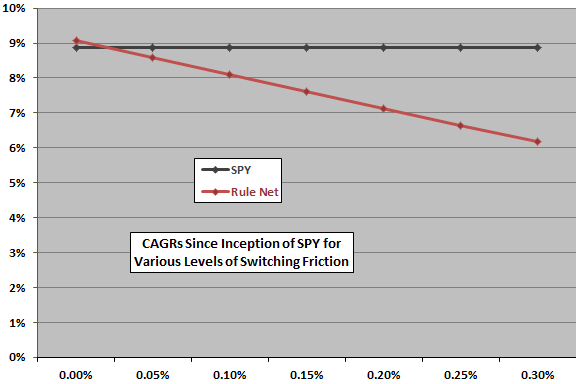
The next chart shows how CAGR of the trading rule for the entire sample period varies with levels of stocks-cash switching friction ranging from 0.00% to 0.30%. Based on CAGR, the trading rule is competitive with buy-and-hold only for extremely low switching frictions. In other words, exploitation is impractical for many individual investors.
Are findings robust across subperiods based on book and article publication dates?
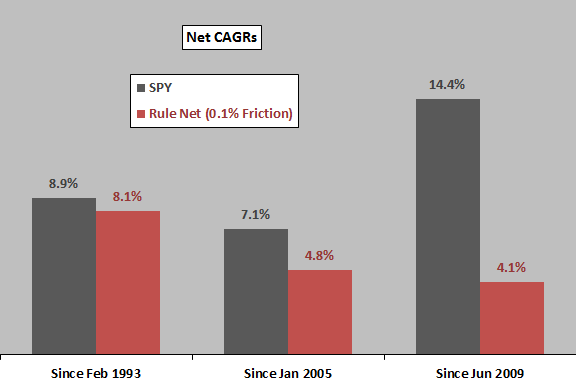
The final chart summarizes CAGRs for buying and holding SPY and Rule Net during three periods:
- The entire available sample period (Since Feb 1993).
- The subperiod after the second printing likely went to press (Since Jan 2005).
- The subperiod after the publication of the referenced article (Since Jun 2009).
The number of switching signals for the three periods are 209, 101 and 60, respectively. Based on CAGR, Rule Net is competitive with SPY over the entire sample period, but is not competitive over the two subperiods (dramatically for the shorter one).
Potential explanations include: (1) the rule derives from pre-2005 snooping and is therefore biased (lucky) in older data; (2) conversely, recent subsamples are unlucky; (2) rule performance is sensitive to the bull-bear ratio of the sample period; and, (3) investors have adapted to the rule and extinguished or reversed its effectiveness.
MaxDDs for the three subperiods for SPY (Rule Net) are -55%, -55% and -41% (-28%, -28% and -22%), so risk-averse investors may find Rule Net attractive anyway.
In summary, evidence from simple tests offers little support for belief that the intermediate-term strength of a “risky” stock index relative to a “conservative” index reliably generates net market outperformance.
Cautions regarding findings include:
- As noted, pre-publication effectiveness of the trading rule may be a consequence of discovering luck from testing many signals on the same pre-2005 data. Trading rules may draw the most attention in articles at times of “peak luck.”
- The sample period/subperiods are all small in terms of number of bull and bear markets.