
It is arguable that many exchange-traded fund (ETF) momentum strategy tests derive more from logical/programming simplicity than common portfolio management practices. Does momentum work for portfolios of ETFs when melded with the latter? In his March 2012 paper entitled “Tactical Asset Allocation Using Relative Strength”, John Lewis tests ETF momentum in the context of real-world portfolio practices. He employs a universe of nearly 100 ETFs encompassing U.S. equity sectors and styles, international/global equities, bonds, commodities, real estate and currencies, including some inverse funds. After initial selection of top ETFs, he replaces weakening funds with strong ones as needed based on daily (or weekly) prices rather than at a fixed interval, depending on four parameters: (1) momentum ranking interval; (2) number of ETFs in the portfolio; (3) buy rank threshold; and, (4) sell rank threshold. To test robustness, he conducts multiple trials based on random selection of ETFs above the buy rank threshold. Specifically, he presents seven examples of 100 iterations of 10-ETF portfolios randomly selected from the top 25% of the ETF universe based on momentum ranking intervals of one month to two years, replacing ETFs when they fall out of the top 25%. Portfolios are apparently equally weighted at initial formation. Examples ignore dividends, management fees and trading frictions. Using daily returns for the ETFs from the end of 1999 through the end of 2011 (12 years), he finds that:
- For the featured 6-month ranking interval over the entire sample period:
- Average (median) gross return for the 100 portfolio trials is 199% (197%), compared to -14% for the S&P 500 Index, 112% for a fixed income market aggregate and 74% for a 60/40 mix of stocks/bonds.
- The gross return for the worst trial is 122%, still beating all three benchmarks.
- During 2005-2007 (2011), all (none) of the 100 trial portfolios beat all (any) of the three benchmarks.
- For ranking intervals of three, six, nine and 12 months, all 100 trial portfolios beat the S&P 500 Index over the entire sample period, with average annualized gross returns of 6.6%, 9.6%, 7.9% and 7.4%, respectively.
- Average gross returns for portfolios formed using ranking intervals of one, 18 and 24 months are notably weaker (especially the one-month ranking interval) than those using intervals of three to 12 months.
- Turnover escalates as ranking interval decreases, indicating a critical trade-off between responsiveness to trend change and trading friction for ranking intervals in the range of six to 12 months.
The following chart, representative of findings in the paper, compares the annualized average gross return and estimated average annual turnover of the ETF momentum strategy described above by ranking interval. While a six-month ranking interval maximizes average gross return, a longer ranking interval with lower turnover may maximize average net return.
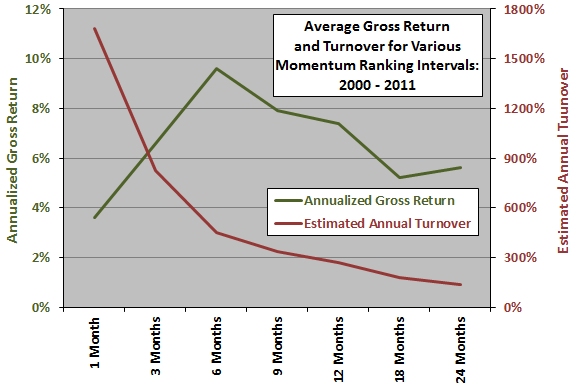
In summary, evidence from tests of ETF momentum in a portfolio management context support belief that ranking intervals in the range three to 12 months outperform simple benchmarks over the past 12 years.
Cautions regarding findings include:
- Many of the ETFs in the specified universe do not exist over much of the test period. Per the author’s disclosure: “Index data was used for some indexes before ETF price data was available.” Indexes do not include the costs of forming tradable assets, which may be material (especially for inverse funds).
- The large ETF universe likely includes groups with highly correlated returns (redundant assets), such that incremental diversity benefit may not offset the higher trading frictions for a more finely divided portfolio.
- As noted above (and in the author’s disclosure), “models do not reflect the reinvestment of dividends” and “returns of the models do not reflect any management fees, transaction costs, or other expenses that would reduce the returns of an actual portfolio.” Including realistic fees and trading frictions would reduce returns, perhaps decisively for portfolios of modest value.
- Assessment of the timing ability of tactical asset class allocation requires a benchmark encompassing the same set of assets, such as value-weighted or equal-weighted portfolios of the ETF universe (or a randomly selected subset). The equally weighted, occasionally rebalanced ETF universe may be stiff competition for the average momentum portfolio.
See “Melding Momentum and Stock Portfolio Management Practices” for a comparable approach using U.S. stocks. See “Simple Asset Class ETF Momentum Strategy” for a simplified momentum approach involving ETFs as asset class proxies.
Frequently Asked Questions
What is an ETF momentum strategy?
An ETF momentum strategy ranks exchange-traded funds by recent past performance and holds the top-ranked funds, replacing those whose rank weakens. In the tested version, a universe of nearly 100 ETFs (U.S. equity sectors and styles, international equities, bonds, commodities, real estate and currencies) is ranked over intervals of one month to two years, and portfolios hold 10 ETFs drawn from the top 25%.
Does momentum work for portfolios of ETFs?
ETF momentum portfolios outperformed simple benchmarks over 2000-2011 when ranking intervals were three to 12 months. With a six-month ranking interval, average annualized gross return was 9.6%, versus -1.3% for the S&P 500 Index, and all 100 trial portfolios beat the S&P 500. Results are gross of fees, dividends and trading costs, and none of the trials beat any benchmark in 2011.
How is an ETF momentum portfolio built and tested for robustness?
The ETF momentum portfolio is built by selecting top-ranked ETFs, then replacing weakening funds with strong ones based on daily or weekly prices rather than at fixed intervals. Four parameters govern it: momentum ranking interval, number of ETFs held, buy rank threshold and sell rank threshold. Robustness is tested with 100 trials of 10-ETF portfolios randomly selected from the top 25% of the universe, using daily returns from the end of 1999 through 2011 and ranking intervals from one month to two years.
How do ETF momentum portfolios compare to the S&P 500, bonds and a 60/40 stock-bond mix?
ETF momentum portfolios with a six-month ranking interval beat all three benchmarks over the full period. Average (median) cumulative gross return across 100 trials was 199% (197%), versus -14% for the S&P 500, 112% for a fixed income aggregate and 74% for a 60/40 stock/bond mix. Even the worst trial returned 122%, though a fairer benchmark would be an equal-weighted portfolio of the same ETF universe, which was not tested.
What are the limitations of backtested ETF momentum strategy results?
The ETF momentum results are gross of dividends, management fees and trading frictions, so realistic costs would reduce returns, perhaps decisively for small portfolios. Many ETFs did not exist for much of the test period, so index data substituted for them, and indexes ignore the costs of forming tradable assets, especially for inverse funds. The large universe also likely includes highly correlated, redundant assets, and faster ranking intervals raise turnover, so a longer interval with lower turnover might maximize net return.