Do U.S. equity exchange-traded funds (ETF) exhibit long-term momentum? In their October 2019 paper entitled “ETF Momentum”, Frank Li, Melvyn Teo and Chloe Yang investigate future performance of U.S. equity ETFs sorted on multi-year past returns. Each month starting August 2004, they:
- Sort selected ETFs into tenths (deciles) based on returns over the past two, three or four years, with focus on three years.
- Reform an equal-weighted (EW) or value-weighted (VW) portfolio that is long (short) the decile with the highest (lowest) past returns, with focus on value-weighted.
They then evaluate performances of deciles and long-short portfolios based on raw return, 4-factor (adjusting for market, size, book-to-market and momentum) alpha and 5-factor (replacing momentum with profitability and investment) alpha. Using monthly returns, market capitalizations and net asset values for all U.S. equity ETFs with capitalizations greater than $20 million and share price greater than one dollar during August 2000 through June 2018, they find that:
- At the start (end) of the sample period, there are 50 (396) qualifying U.S. equity ETFs.
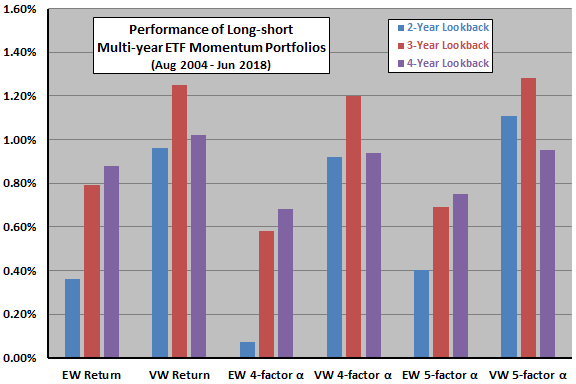
- In general (see the chart below):
- Long-short multi-year momentum portfolios generate substantially positive returns.
- The optimal long-short VW portfolio based on past 3-year returns generates average gross monthly return 1.25%, gross monthly 4-factor alpha 1.20% and gross monthly 5-factor alpha 1.28%.
- EW long-short portfolios materially underperform VW portfolios, suggesting that the largest ETFs drive the effect.
- However, returns are volatile, discouraging to traders with short investment horizons.
- Neither cross-sectional stock momentum, macroeconomic variables nor liquidity explain multi-year ETF momentum.
- Findings are generally robust to:
- Estimated monthly portfolio rebalancing frictions.
- Extending the long-short portfolio holding period from one to three, six, nine or 12 months (with overlapping portfolios).
- Using returns calculated from ETF net asset values (NAV) rather than ETF prices.
The following chart, constructed from data in the paper, summarizes performance of long-short multi-year ETF momentum portfolios for both weighting schemes and all three lookback intervals. Results show that the optimal combination is VW with 3-year lookback interval.
In summary, evidence suggests that U.S. equity ETFs exhibit multi-year momentum.
Cautions regarding findings include:
- The sample period is extremely short for testing the specified strategy. For example, the full sample period has fewer than five independent 4-year lookback intervals.
- Average monthly return is not sufficient to assess strategy attractiveness. Many investors are concerned about return variability (Sharpe ratio) and maximum drawdown.
- As tested, portfolios hold too many assets in later years for most individual investors.
- Testing multiple lookback intervals and weighting schemes on the same data introduces data snooping bias, such that the best results (VW with 3-year lookback) overstates expectations.
- The specified setup may not work for ETFs tracking asset classes other than U.S. equities.