A subscriber requested testing Martin Zweig’s Combined Super Model, which each month specifies an equity allocation based on a system that assigns up to eight points from his Monetary Model and 0 or 2 points from his Four Percent Model. We consider two versions of the Combined Super Model:
- Zweig-Cash – Allocate to Fidelity Fund (FFIDX) as equities, with the balance in cash earning the 3-month U.S. Treasury bill (T-bill) yield.
- Zweig-FGOVX – Allocate to FFIDX as equities, with the balance in Fidelity Government Income Fund (FGOVX)
The benchmark is buying and holding FFIDX. We focus on compound annual growth rate (CAGR), maximum drawdown (MaxDD) and annual Sharpe ratio, with average monthly T-bill yield during a year as the risk-free rate for that year. We ignore impediments to mutual fund trading and any issues regarding timeliness of allocation changes for end-of-month rebalancing. Using monthly Combined Super Model allocations and monthly fund returns/T-bill yield during December 1986 through March 2020, we find that:
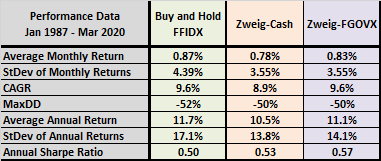
The following table summarizes average monthly returns, standard deviations of monthly returns, CAGRs, MaxDDs, average annual returns (1987-2019), standard deviations of annual returns and annual Sharpe ratios for the benchmark and the two Combined Super Model versions. Combined Super Model versions:
- Do not boost CAGR.
- Generate slightly shallower, but still deep, MaxDDs.
- Offer modestly higher Sharpe ratios by lowering annual volatilities.
Given uncertainties in model execution and the possibility that test and model development periods overlap (introducing some data snooping bias), the Sharpe ratio improvements are not compelling.
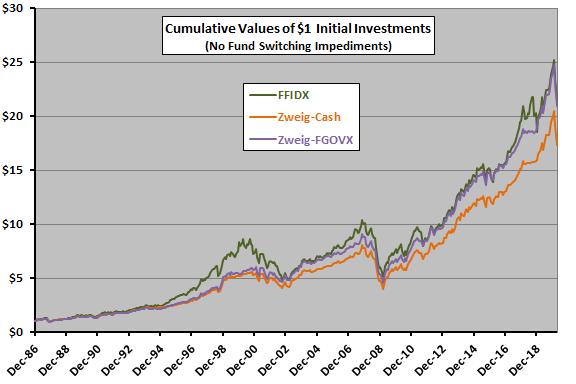
For perspective, we look at cumulative performances.
The following chart tracks cumulative values of $1 initial investments in the benchmark and the two Combined Super Model versions over the full sample period. On most days, the benchmark wins, with much of its higher volatility upside.
In summary, evidence indicates that Martin Zweig’s Combined Super Model applied to a diversified U.S. equity fund may offer modest improvement in risk-adjusted, but not raw, performance.
Cautions regarding findings include:
- There may have been impediments to monthly mutual fund rebalancing as assumed (such as loads and/or 1-month redemption penalties) during the sample period.
- Monthly model allocation changes may not be available for precise end-of-month mutual fund rebalancing.
- As noted, model development and test periods may overlap, incorporating snooping bias into test results.
See also “Martin Zweig’s Four Percent Model” from some years ago.