
Subscribers have asked whether substituting Market Vectors Gold Miners ETF (GDX) for SPDR Gold Shares (GLD) as a proxy for gold improves the performance of the Simple Asset Class ETF Momentum Strategy (SACEMS)? To check, we backtest the strategy twice using either GLD or GDX to represent gold, and then compare results. Using dividend-adjusted closing prices for SACEMS asset class proxies and the yield for Cash during June 2006 (per tracked SACEMS) through September 2020, we find that:
As in the baseline version of SACEMS, we each month rank all assets based on 4-month past returns. Because GDX is not available until May 2006, we use GLD to determine whether GDX is a winner at the beginning of the sample period until September 2006.
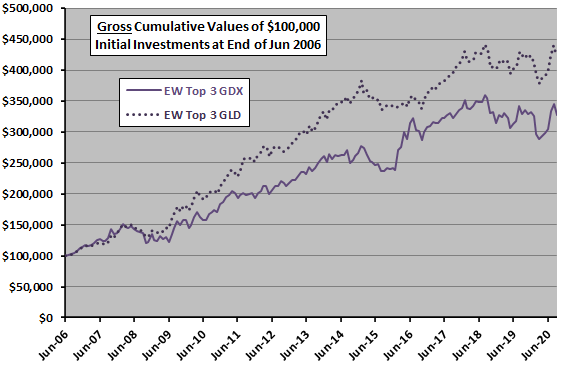
The following chart compares gross cumulative values of $100,000 initial investments in the SACEMS equally weighted (EW) Top 3 portfolio with GDX or with GLD. The GDX alternative underperforms substantially. Results from “GDX and GDXJ vs. GLD” suggest that the high volatility of GDX compared to GLD drive the underperformance.
For perspective, we compare monthly and annual performance statistics for the two alternatives across three SACEMS portfolios.
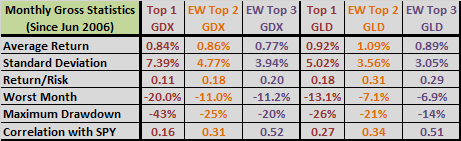
The following table summarizes monthly statistics for SACEMS Top 1, EW Top 2 and EW Top 3 portfolios with GDX or GLD over the full sample period. Return/Risk is average return divided by standard deviation. Maximum drawdowns are based on monthly measurements over the sample period. Confirming above results, SACEMS with GLD generally beats SACEMS with GDX.
The next table summarizes annualized/annual statistics for SACEMS Top 1, EW Top 2 and EW Top 3 portfolios with GDX or GLD over the full sample period. Annualized returns are compound annual growth rates (CAGR). For Sharpe ratio, to calculate excess annual return, we use average monthly yield on 3-month Treasury bills during a year as the risk-free rate for that year. Again, SACEMS with GLD generally beats SACEMS with GDX.

In summary, evidence does not support belief that GDX is a better choice than GLD as a proxy for gold in SACEMS.
Cautions regarding findings include:
- Cautions for SACEMS apply.
- Testing alternative proxies for an asset class introduces data snooping bias, thereby overstating performances of best and worst alternatives.
Frequently Asked Questions
What is the Simple Asset Class ETF Momentum Strategy (SACEMS)?
The Simple Asset Class ETF Momentum Strategy (SACEMS) is a momentum strategy that each month ranks a set of asset class ETF proxies, including gold, by their past 4-month returns and holds the top performers. It can be run as a Top 1 portfolio or as equally weighted Top 2 or Top 3 portfolios, with Cash (Treasury yield) as an alternative asset.
Does using GDX instead of GLD improve momentum strategy returns?
Using GDX instead of GLD does not improve SACEMS performance; SACEMS with GLD generally beats SACEMS with GDX across the Top 1, equally weighted Top 2 and equally weighted Top 3 portfolios. This holds over June 2006 through September 2020, and the GDX version underperforms substantially in the Top 3 cumulative value comparison. The evidence does not support GDX as a better gold proxy than GLD.
How do you backtest gold ETF substitutions in a momentum strategy?
The backtest runs SACEMS twice, once with GLD and once with GDX representing gold, ranking all assets monthly on 4-month past returns using dividend-adjusted closing prices and Cash yield. Because GDX was not available until May 2006, GLD determines whether gold is a winner through September 2006. Results are compared using monthly statistics (Return/Risk, maximum drawdown) and annualized statistics (CAGR, Sharpe ratio using average 3-month Treasury bill yield as the risk-free rate).
Why does a gold miners ETF like GDX perform differently from a physical gold ETF like GLD?
GDX, which holds gold mining stocks, is far more volatile than GLD, which tracks gold, and this higher volatility appears to drive GDX's underperformance as a gold proxy in SACEMS. The article cites prior research ("GDX and GDXJ vs. GLD") suggesting this volatility difference as the cause. As a result, GDX did not deliver better results than GLD in the Top 1, Top 2 or Top 3 portfolios.
What are the limitations of testing alternative ETF proxies in a backtest?
Testing alternative proxies for an asset class introduces data snooping bias, which overstates the performance of the best and worst alternatives. The cautions that apply to SACEMS generally also apply to these findings. The GDX versus GLD results cover only June 2006 through September 2020, with GLD used to determine GDX's signal until September 2006 because GDX was unavailable earlier.