Which equity factors have high and low expected returns? In their February 2017 paper entitled “Forecasting Factor and Smart Beta Returns (Hint: History Is Worse than Useless)”, Robert Arnott, Noah Beck and Vitali Kalesnik evaluate attractiveness of eight widely used stock factors. They measure alpha for each factor conventionally via a portfolio that is long (short) stocks with factor values having high (low) expected returns, reformed systematically. They compare factor alpha forecasting abilities of six models:
- Factor return for the last five years.
- Past return over the very long term (multiple decades), a conventionally used assumption.
- Simple relative valuation (average valuation of long-side stocks divided by average valuation of short-side stocks), comparing current level to its past average.
- Relative valuation with shrunk parameters to moderate forecasts by dampening overfitting to past data.
- Relative valuation with shrunk parameters and variance reduction, further moderating Model 4 by halving its outputs.
- Relative valuation with look-ahead full-sample calibration to assess limits of predictability.
They employ simple benchmark forecasts of zero factor alphas. Using 24 years of specified stock data (January 1967 – December 1990) for model calibrations, about 20 years of data (January 1991 – October 2011) to generate forecasts and the balance of data (through December 2016) to complete forecast accuracy measurements, they find that:
- Model 1 generates forecasts with the largest mean squared error (MSE). In fact, its forecasts have negative correlation with subsequent factor alphas and are 127% less accurate than the benchmark forecast of zero factor alphas.
- Model 2 is more accurate than Model 1, but its forecasts also have negative correlation with subsequent factor alphas and are 21% less accurate than the benchmark forecasts.
- Models 3-6 all generate forecasts that have moderately positive correlations with subsequent factor alphas, and…
- Model 3 is still 8% less accurate than the benchmark assumption of zero factor alphas.
- Model 4 is 9% more accurate than the benchmark.
- Model 5 is 14% more accurate than the benchmark, but less like subsequent factor alphas in terms of variability.
- Model 6, with perfect foresight of actual factor alphas, is 27% more accurate than the benchmark.
- Applying Model 4 to forecast factor gross alphas over the next five years both for the U.S. market (see the chart below) and for international developed and emerging markets:
- Forecasted gross alphas for the low beta factor, and for corresponding low beta and low-volatility smart beta strategies relative to their benchmarks, are negative in all markets.
- Forecasted gross alphas for the size factor, and for corresponding size and equal weight smart beta strategies relative to their benchmarks, are negative in all markets.
- Forecasted gross alphas for the value factor, and for corresponding fundamental indexing and income smart beta strategies relative to their benchmarks, are attractive in all markets.
- Forecasted gross alphas for the momentum factor are slightly above historical norms in all markets, but momentum forecasts can change quickly.
- Forecasted gross alphas for the gross profitability factor, and for corresponding quality smart beta strategies relative to their benchmarks, are attractive in the U.S. market.
- Portfolio maintenance costs are particularly high for momentum and low-volatility strategies, such that net outlooks are much weaker than gross outlooks.
The following chart, taken from the paper, depicts 5-year expected gross returns versus volatilities based on Model 4 above for eight U.S. stock market factors (long-short hedge portfolios) as of the end of 2016. Value Composite combines several value metrics, while Value P/B uses only price-to-book value ratios. Results show that Value Composite, Momentum and Gross Profitability factors are attractive, and Low Beta and Size are not, on a gross basis.
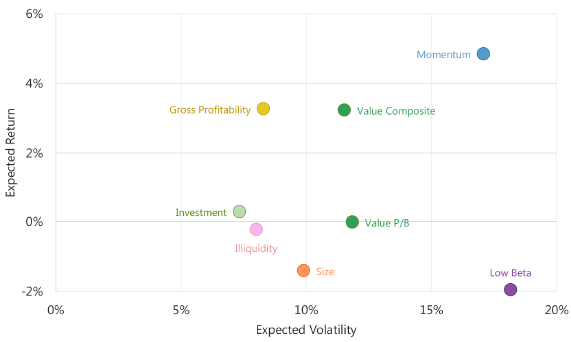
In summary, evidence from relative valuation analysis suggests that composite value and gross profitability factors may be the most attractive on a net basis over the next few years.
Cautions regarding findings include:
- Definition of “short-term” as 5-year past return is at odds with conventional momentum research, which typically uses one or a few months as short-term, three to 12 months as intermediate-term and multi-year as long term. Such research generally also finds reversion for 3-year to 5-year lookbacks.
- Discussion of portfolio maintenance costs are for institution-sized investors. Individuals may experience materially higher impacts.
- Calculations of factor/smart beta relative valuations is beyond the reach of most investors, who would bear fees for delegating the calculations to an advisor.
- Testing many forecasting models on the same data introduces model snooping bias, such that the best-performing model impounds lucky processing of sample noise and therefore overstates expected forecast accuracy.