Momentum Strategy
Ranks ETFs by recent returns and holds top performers.
Signal for April 2026 (Final)
Winner
2nd
3rd
Two systematic approaches to enhance your portfolio with monthly signals.
Ranks ETFs by recent returns and holds top performers.
Signal for April 2026 (Final)
Allocates based on relative valuations across asset classes.
Signal for April 2026 (Final)
Momentum and value target different market inefficiencies.
Are the “Simple Asset Class ETF Value Strategy” (SACEVS) and the “Simple Asset Class ETF Momentum Strategy” (SACEMS) mutually diversifying. To check, based on feedback from subscribers about combinations of interest, we look at three equal-weighted (50-50) combinations of the two strategies, rebalanced monthly:
We consider as a benchmark a simple technical strategy (SPY:SMA10) that holds SPDR S&P 500 ETF Trust (SPY) when the S&P 500 Index is above its 10-month simple moving average and 3-month U.S. Treasury bills (Cash, or T-bills) when below. We also test sensitivity of results to deviating from equal SACEVS-SACEMS weights. Using monthly gross returns for SACEVS, SACEMS, SPY and T-bills during July 2006 through August 2025, we find that:
Correlations of monthly returns between components of 50-50 Best Value – EW Top 2, 50-50 Best Value – EW Top 3 and 50-50 Weighted – EW Top 3 are 0.34, 0.46 and 0.52, respectively, indicating that the value and momentum strategies moderately diversify each other.
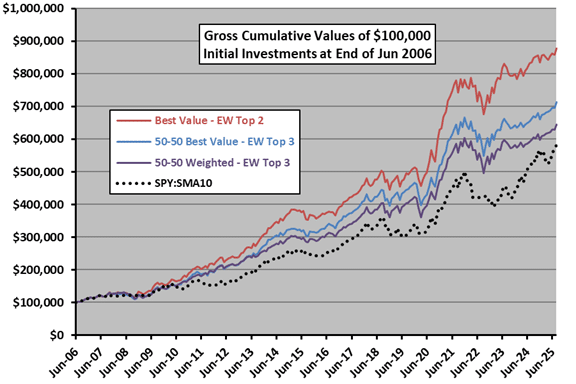
The following chart plots gross cumulative values of $100,000 initial investments in each of the three 50-50 SACEVS-SACEMS combinations specified above and SPY:SMA10 over the full sample period. Notable points are:
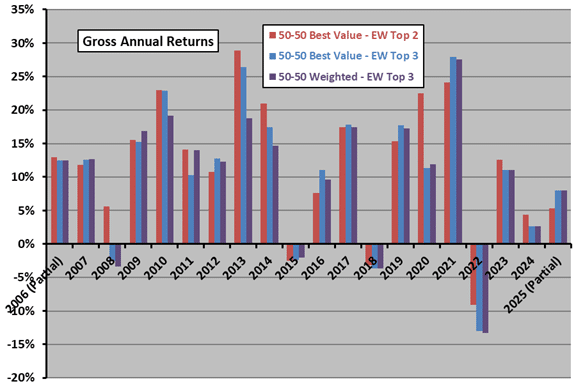
For another perspective, we look at calendar year returns.
The next chart summarizes gross annual returns for 50-50 Best Value – EW Top 2, 50-50 Best Value – EW Top 3, 50-50 Weighted – EW Top 3 and SPY:SMA10. Using average monthly T-bill yield during a year as the risk-free rate for that year, respective gross annual Sharpe ratios for full years 2007 through 2023 are 0.99, 0.82, 0.82 and 0.64.
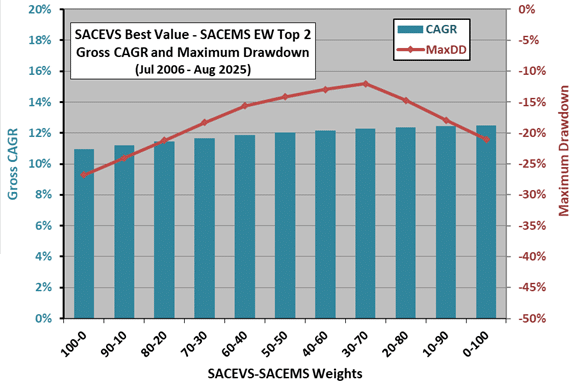
Are 50-50 mixes optimal?
The next chart summarizes CAGR and MaxDD sensitivities to Best Value – EW Top 2 weights, ranging from 100% allocation to SACEVS Best Value (100-0) to 100% allocation to SACEMS EW Top 2 (0-100). Results suggest that a tilt toward SACEMS EW Top 2 is optimal, but the sample period is short for this level of discrimination.
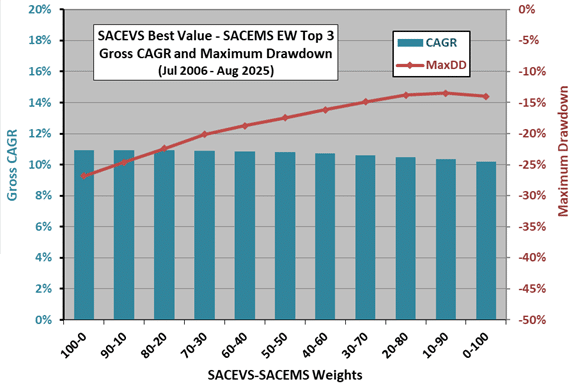
The next chart summarizes CAGR and MaxDD sensitivities to Best Value – EW Top 3 weights, ranging from 100% allocation to SACEVS Best Value (100-0) to 100% allocation to SACEMS EW Top 3 (0-100). Results do not clearly suggest any tilt, depending on investor drawdown tolerance, but again the sample period is short for this level of discrimination.
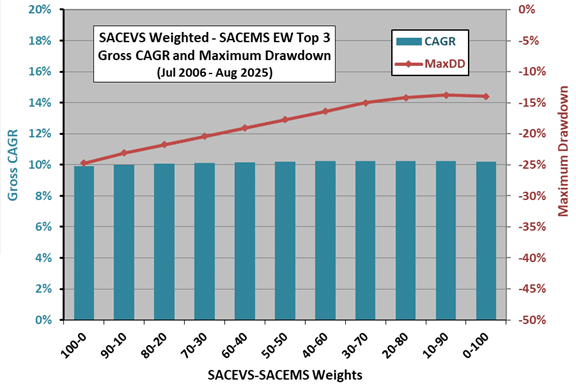
The final chart summarizes CAGR and MaxDD sensitivities to SACEVS Weighted and SACEMS EW Top 3 weights, ranging from 100% allocation to SACEVS Weighted (100-0) to 100% allocation to SACEMS EW Top 3 (0-100). Results suggest that a tilt toward SACEMS EW Top 3 is optimal, but again the sample period is short for this level of discrimination.
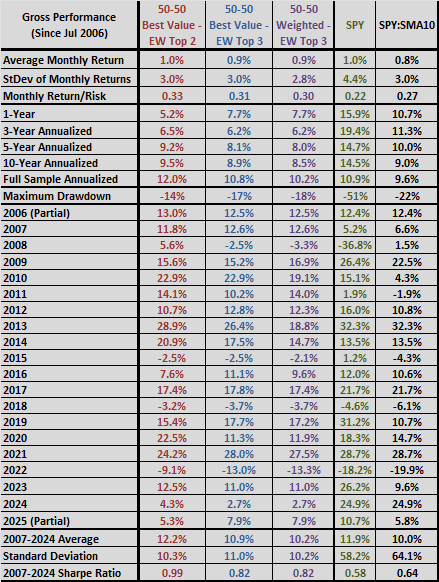
For reference, the following table provides detailed gross performance statistics for the three combination strategies with 50-50 allocations, and those for SPY and SPY:SMA10. Monthly return/risk is average monthly return divided by standard deviation of monthly returns.
In summary, evidence from available samples suggests that SACEMS and SACEVS in combination usefully diversify each other.
Cautions regarding findings include:
See “Combined Value-Momentum Strategy (SACEVS-SACEMS)” for monthly tracking of the above three 50-50 combination strategies.
Track the performance of 50-50 blended portfolios
Combined StrategyBacktest growth and blend strategies interactively
Strategy ToolsSubscribe to unlock current ETF signals and full strategy details.
Already a member? Log in