
Does a low-beta strategy work for mutual funds? In his September 2012 paper entitled “Capitalizing on the Greatest Anomaly in Finance with Mutual Funds”, David Nanigian examines portfolios of funds sorted on lagged beta to determine whether mutual fund investors can capitalize on outperformance of low-beta assets. He calculates rolling betas for each mutual fund based on monthly returns over the prior 60 months (or less, as few as 24 months, when 60 months of returns are unavailable) or 12 months. He then ranks funds based on lagged betas into asset-weighted fifths each month and holds for one month, or each year and holds for one year. Using monthly net returns and total assets for a broad sample of U.S. equity open-end mutual funds, along with contemporaneous U.S. stock market returns, the risk-free rate and commonly applied risk factors, during December 1990 through April 2012, he finds that:
- Low-beta mutual funds tend to have similar future returns and lower future volatilities compared to high-beta funds, and therefore higher net Sharpe ratios (see the chart below). Results hold for:
- Both 60-month and 12-month lagged beta ranking intervals.
- Both monthly and annual ranking of funds.
- An asset-weighted hedge portfolio that is long the fifth (quintile) of mutual funds with the lowest beta and short the quintile with the highest beta generates an annualized net four-factor (market, size, book-to-market, momentum) alpha of 2.2% to 1.4% depending on monthly or annual portfolio reformation and 60-month or 12-month beta ranking interval.
- Low-beta mutual funds tilt modestly toward high book-to-market stocks but not toward high-dividend stocks.
- Mutual fund betas are fairly persistent. For example:
- 49% (41%) of funds in the lowest-beta quintile remain in that quintile 12 (60) months later.
- 44% (35%) of funds migrating from the lowest-beta quintile move only to the second-lowest quintile 12 (60) months later.
The following chart, constructed from data in the paper, summarizes annualized net Sharpe ratios for quintiles of mutual funds ranked annually by 60-month and 12-month lagged betas over the sample period. Results indicate that low-beta funds tend to outperform high-beta funds on a risk-adjusted basis, and that a shorter beta ranking interval outperforms a longer one.
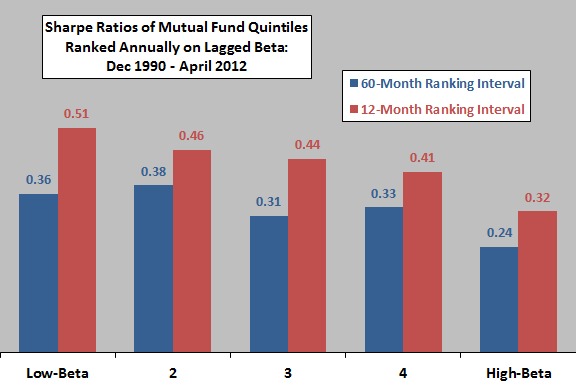
In summary, evidence indicates that mutual fund investors may be able to improve risk-adjusted performance by focusing on low-beta funds.
Cautions regarding findings include:
- Many investors cannot hold enough low-beta mutual funds to capture reported outperformance reliably.
- Attention to low-beta strategies may attenuate the anomaly.
Frequently Asked Questions
What is a low-beta strategy for mutual funds?
A low-beta strategy for mutual funds means favoring funds whose returns have historically moved less than the overall stock market (low beta) and avoiding or shorting high-beta funds. It aims to capture the 'low-beta anomaly,' in which low-beta assets tend to deliver better risk-adjusted returns than high-beta assets. In the study, funds were ranked on beta estimated from prior 60-month or 12-month returns.
Do low-beta mutual funds outperform high-beta mutual funds?
Low-beta mutual funds tend to outperform high-beta funds on a risk-adjusted basis, from December 1990 through April 2012. They have similar future returns but lower volatility, so their net Sharpe ratios are higher. A long/short hedge portfolio (long lowest-beta quintile, short highest-beta quintile) generated annualized net four-factor alpha of 1.4% to 2.2%.
How are mutual funds ranked and tested for a low-beta strategy?
Each fund's beta is calculated from monthly returns over the prior 60 months (as few as 24 if unavailable) or 12 months. Funds are then sorted into asset-weighted quintiles by lagged beta, either monthly with a one-month holding period or annually with a one-year holding period. Performance is evaluated using net returns of U.S. equity open-end funds, with market, size, book-to-market and momentum factors, over December 1990 to April 2012.
Do low-beta mutual funds just tilt toward value or high-dividend stocks?
Low-beta mutual funds tilt only modestly toward high book-to-market (value) stocks and do not tilt toward high-dividend stocks. The 1.4% to 2.2% annualized alpha is measured after controlling for market, size, book-to-market and momentum factors. Low-beta fund outperformance therefore is not explained simply by a value or dividend tilt.
What are the limitations of investing in low-beta mutual funds?
Many investors cannot hold enough low-beta mutual funds to capture the reported outperformance reliably, since the hedge portfolio's alpha relies on a long/short quintile strategy. Growing attention to low-beta strategies may also attenuate the anomaly. Results are also based on a sample covering December 1990 through April 2012, and fund betas are only fairly persistent (49% of lowest-beta quintile funds remain there after 12 months, 41% after 60 months).