Is portfolio downside risk better manageable by combining drawdown and recovery into a single "submergence" metric? In their February 2023 paper entitled "Submergence = Drawdown Plus Recovery", Dane Rook, Dan Golosovker and Ashby Monk present submergence density as a new risk metric to help investors analyze asset/portfolio drawdown and recovery jointly. They define submergence (s) of an asset/portfolio as percentage of current value below its past highwater mark. They define submergence density (d) during a given sample period as the κ-root of the sum of measurement interval submergences each raised to the κ-power during the sample period, as follows:
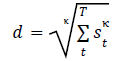
When κ=1, submergence density is arithmetic average drawdown. When κ=∞ (or a very high number), submergence density is maximum drawdown. They use κ = 5 in examples to represent typical investor drawdown sensitivity. They define submergence risk-adjusted return as excess return (relative to the risk-free rate) minus a fraction (Θ) of submergence density, using the range 0.2 to 0.5 as reasonable for Θ. They apply submergence to several market indexes and discuss portfolio diversification and rebalancing in the context of reducing submergence overlaps. Using monthly excess returns for U.S. stocks, corporate bonds and Treasuries (S&P 500 Index, ICE BoA Corporate Bond Index and Bloomberg Treasuries Index, respectively) during 1979 through 2022, they find that:
Subscribe to Keep Reading
Get the research edge serious investors rely on.
- 1,200+ research articles
- Monthly strategy signals
- 20+ years of backtested analysis
Cancel anytime