Trading Calendar – February
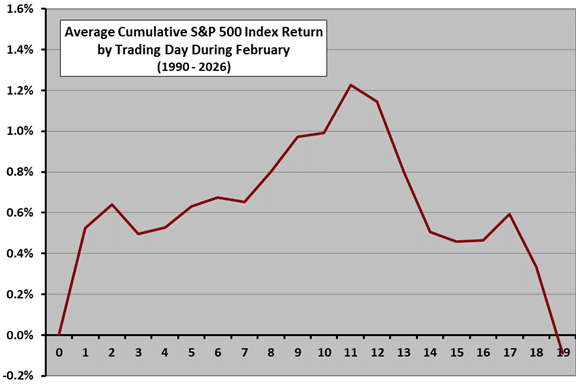
The following chart shows the average month-to-date percentage change in the S&P 500 Index by trading day during February from 1990 through 2026. Day 0 represents the January close. It shows that the index during February tends to be about neutral, with the first half of the month positive and the second half negative. We have not used data for trading day 20, because most Februarys do not have 20 trading days. Also, sample size is at most only 37 for specific trading days, so these results are only mildly suggestive rather than predictive. For 1990-2026, 21 Februarys have been winners and 16 have been losers.
Return to the Trading Calendar to find other monthly profiles.