The guiding belief of the Fed Model of stock market valuation is that investors use a Treasury note (T-note) yield as a benchmark for the expected (forward) earnings yield of the stock market. When the gap between the forward earnings yield and the T-note yield is positive (negative), stocks are relatively attractive (unattractive), and investors bid stocks up (down) to restore yield balance. Does evidence justify this belief? To investigate, we relate the month-end gap between the S&P 500 1-year forward operating earnings yield and the 1-year T-note yield to future returns for the S&P 500 index. We calculate the 1-year forward operating earnings yield from the Earnings Forecast and the level of the S&P 500 Index. Using end-of-month data for the two yields over the period March 1989 (limited by availability of an input variable for the Earnings Forecast) through July 2013 (over 24 years), we find that:
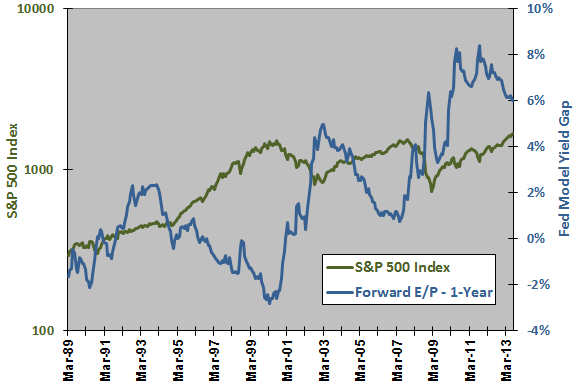
The following chart shows the behaviors of the S&P 500 Index (on a logarithmic scale) and the gap between the S&P 500 forward operating earnings yield and the 1-year T-note yield (Fed Model yield gap) over the available sample period based on month-end data. To convert from the quarterly earnings cycle to a monthly frequency, we assume new earnings data for a quarter becomes known as follows: 50% during the first month after quarter end; 40% during the second month after quarter end; and, 10% during the third month after quarter end. There is no convincingly consistent relationship, but the yield gap is sometimes an approximate mirror image of the index.
Note that over the available sample period, the Fed Model yield gap appears not to have a stable mean. In other words, the yield gap does not exhibit reversion to a mean value.
For precision, we relate the Fed Model yield gap to stock market returns over fixed future intervals.
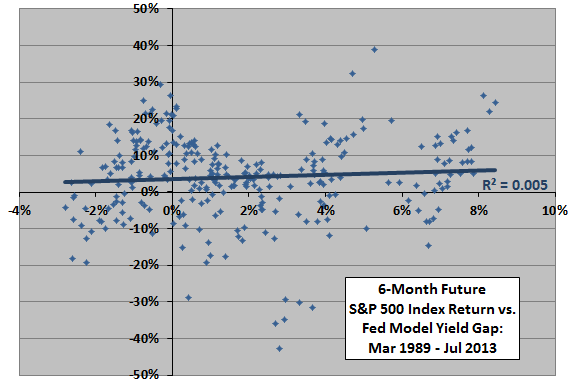
The following scatter plot relates the 6-month future return for the S&P 500 Index to the Fed Model yield gap based on month-end data over the available sample period (287 observations). The Pearson correlation between the two series is 0.07 and the R-squared statistic is 0.005, indicating practically no relationship between the two series.
For a future return measurement interval of three (3) months, the Pearson correlation is 0.03 and the R-squared statistic is 0.001.
To check for an exploitable non-linearity in the relationship, we calculate S&P 500 Index future returns by ranges of the Fed Model yield gap.
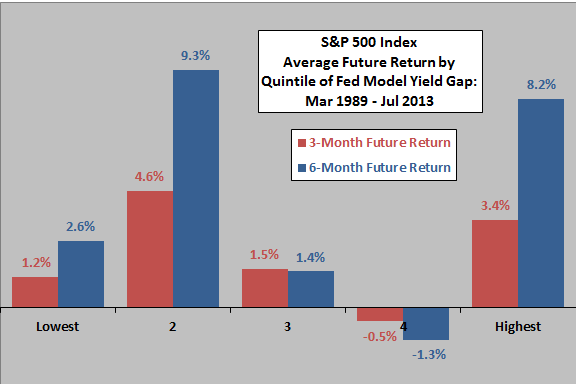
The final chart summarizes the average 3-month and 6-month future returns for the S&P 500 Index by ranked fifth (quintile) of the Fed Model yield gap over the available sample period. There is no apparent systematic relationship across quintiles between future stock market returns and the Fed Model yield gap for any of the three return intervals.
Note that the sample size is modest for a quintile breakdown in terms of number of return intervals.
What about alternatives to the 1-year T-note yield for calculating the Fed Model yield gap?
We repeat the above tests using the 13-week Treasury bill yield, the 10-year T-note yield and Moody’s Seasoned Baa Corporate Bond Yield instead of the 1-year T-note yield. The R-squared statistics for the relationship between current Fed Model yield gap and 6-month future S&P 500 Index returns are unimpressive (0.005, 0.01 and 0.03, respectively).
Finally, using past operating earnings rather than the Earnings Forecast generally lowers correlations and R-squared statistics between the Fed Model yield gap and future stock market returns.
In summary, evidence from simple tests does not support a belief that the Fed Model usefully predicts stock market returns at horizons of three and six months.
Cautions regarding findings include:
- The above tests are in-sample. An investor operating in real time would likely experience different findings. In-sample findings are not strong enough to motivate out-of-sample testing (with necessarily very small samples).
- Some other method of forecasting operating earnings (rather than the Earnings Forecast) may work better. As-reported (GAAP) earnings may work better.
- As noted, the sample period is modest for some tests.