How well does stock screening research translate into performance? In the mid-1990s, James O’Shaughnessy identified “cornerstone value” and “cornerstone growth” as best-of-breed equity investment strategies. The former emphasizes dividends among large-capitalization stocks, and the latter momentum/earnings growth for a broader universe. Based on Standard and Poor’s Compustat data, he found that the value (growth) strategy returned 15% (18%) per year during 1952-1994, compared to 8.3% for the S&P 500 Index. He implemented these two strategies in late 1996 via mutual funds and publicized them in early editions of his book What Works on Wall Street: A Guide to the Best-Performing Investment Strategies of All Time. He subsequently sold the mutual funds (which apply slightly different portfolio formation rules from those specified in the original research) to Hennessy Funds in 2000, where they survive as the Hennessy Cornerstone Value Fund (HFCVX) and the Hennessy Cornerstone Growth Fund (HFCGX). Do these funds outperform simpler exchange-traded funds (ETF) that track their respective benchmarks funds: iShares Russell 1000 Value Index (IWD) for HFCVX and iShares Russell 2000 Index (IWM) for HFCGX? Using monthly total returns for HFCVX, HFCGX, IWD and IWM during May 2000 (inception of the ETFs) through July 2013, we find that:
According to Hennessy Funds, they specify the holdings of HFCVX and HFCGX annually by “strictly adhering to the following time-tested, quantitative formula[s]” applied to the Compustat database, as follows:
HFCVX managers screen for large capitalization value firms (excluding utility companies) based on: (1) market capitalization above the average of the database; (2) number of shares outstanding above the average of the database; (3) 12-month sales 50% greater than the average of the database; and, (4) cash flow above the average of the database. They then select the 50 stocks with the highest dividend yield.
HFCGX managers pursue a strategy that “marries value with momentum” via screening based on: (1) market capitalization above $175 million; (2) price-to-sales ratio below 1.5; (3) annual earnings higher than the previous year; and, (4) positive returns over the past three and six months. They then select the 50 stocks with the highest 12-month past return. [Item (1) may have grown over the years.]
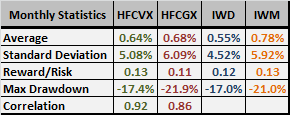
The following table compares monthly total return statistics of the funds and their benchmark ETFs over the available sample period.
HFCVX has a somewhat higher average monthly return and standard deviation of monthly returns, and therefore slightly higher reward-to-risk ratio than IWD. It also has a slightly larger maximum monthly drawdown than IWD. The correlation of monthly returns between the two funds is 0.92.
HFCGX has a somewhat lower average monthly return and higher standard deviation of monthly returns, and therefore somewhat lower reward-to-risk ratio than IWM. It also has a slightly larger maximum monthly drawdown than IWM. The correlation of monthly returns between the two funds is 0.86.
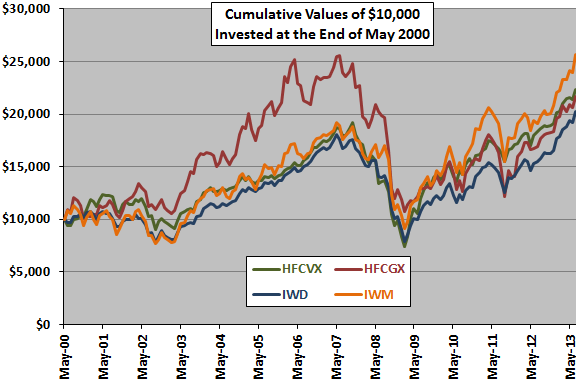
How do these monthly statistics translate to cumulative performance?
The following chart tracks the year-end values of $10,000 initial investments in each of HFCVX, HFCGX and the benchmark ETFs over the available sample period.
HFCVX mostly, but modestly, outperforms IWD. Terminal values are $22,231 and $20,205 for HFCVX and IWD, respectively.
HFCGX sometimes outperforms and sometimes underperforms IWM. Terminal values are $21,874 and $25,713 for HFCGX and IWM, respectively.
The compound annualized return for HFCVX (HFCGX) is roughly 6.3% (6.1%), compared to 5.5% (7.4%) for IWD (IWM).
What are possible reasons that HFCVX and HFCGX do not exhibit the kind of outperformance observed in original historical tests?
Possible reasons the out-of-sample performances of HFCVX and HFXGX fall well short of backtest results are:
- The out-of-sample test is short in terms of number of business cycles and may be unlucky for the mutual funds.
- The historical tests exclude trading frictions and management/administrative fees, which the actual funds must absorb.
- Data snooping bias adds material helpings of luck to the backtested performance.
- The market has changed. For example, the expansion of stock buybacks in lieu of dividends is largely absent from the historical test period and may disrupt the dividend-based strategy of HFCVX.
- The market adapted since publication of the cornerstone strategies, with more and more investors competing for the abnormal returns from similar strategies.
- Deviations by the fund managers from the original backtest specifications suppresses strategy performance.
In summary, as found for the “cornerstone” strategies, what worked on Wall Street in past decades may or may not work in future decades. Implementation compromises and frictions, bias derived from mining noisy data and changing/adaptive investment environments confound strategy development.