
A reader commented and suggested: “Because bond trading costs would probably dwarf the excess profits described in ‘Momentum in U.S. Corporate Bond Returns’ for individual investors, perhaps the relevant question is whether switching from one junk bond fund to another based on 6-month momentum (with one skip-month) is effective.” Since the momentum in this case belongs to an asset class (junk bonds) rather than to specific bonds within it, a more useful investigation might be whether one should get in and out of junk bond funds based on momentum. Using monthly dividend-adjusted closes for the T. Rowe Price High-Yield mutual fund (PRHYX) and the 13-week Treasury bill (T-bill) yield (a proxy for return on cash) during September 1990 through July 2010 (239 months), we find that:
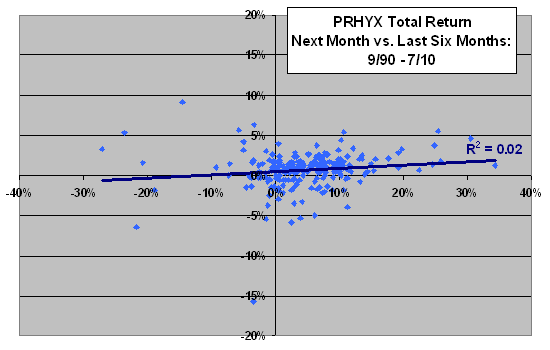
The following scatter plot relates PRHYX total return next month to PRHYX total return over the last six months over the entire sample period. The Pearson correlation for the relationship is 0.14, and the R-squared statistic is 0.02, indicating that past return explains 2% of the next-month return. Inserting a skip-month reduces the correlation to 0.03 and R-squared to 0.00 over the entire sample period, suggesting that use of a skip-month is not helpful.
Note that a sample of only 40 non-overlapping six-month return intervals, with some intervals of extreme variability in monthly returns (especially late 2008 through early 2009, does not promise reliability. For example:
- Excluding the single monthly return of April 2009 (paired with the past return for September 2008 through March 2009) increases R-squared to 0.04.
- Over the first half of the sample period (ending October 2000), the correlation is 0.20 and R-squared is 0.04. Over the second half, the correlation is 0.12 and R-squared is 0.01.
For another perspective that accommodates non-linearity, we try a ranking approach.
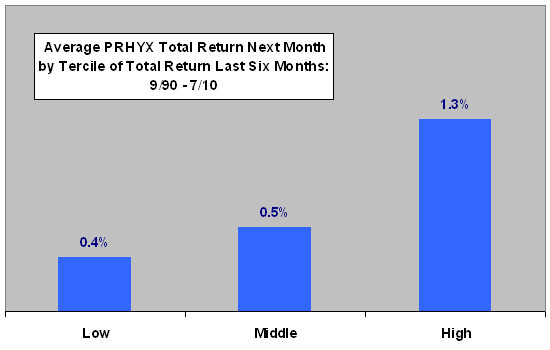
The next chart summarizes PRHYX average total return next month by tercile of PRHYX returns for the past six months over the entire sample period (no skip-month). The number of observations in each tercile is 77-78. Results offer support for a belief that return momentum exists for an investable collection of junk bonds.
The standard deviation of monthly returns within the lowest tercile is much higher than those within the other two.
Could a trader have beaten buying and holding the fund by using momentum measurements to switch between the fund and cash?
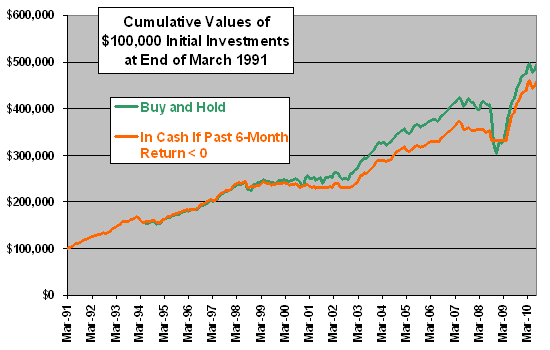
The final chart compares cumulative values of $100,000 investments initiated at the end of March 1991 for two strategies:
- Buying and holding PRHYX.
- Holding PRHYX (cash, with a return equal to that of T-bills) when the fund’s total return over the past six months is positive (negative). The 0% past return threshold is arbitrary.
Calculations assume trades occur at month ends, coincident with momentum measurements. Such anticipation is somewhat problematic with mutual funds, priced only daily after the close. Calculations also assume no trading frictions or tax implications.
Results suggest that switching between the fund and cash roughly matches or slightly underperforms buying and holding the fund. For past return thresholds in the range of 3-5%, switching between the fund and cash marginally beats buying and holding the fund. An investor operating in real time would not know the optimum threshold (but might choose a threshold based on the historical risk-free rate rather than 0%).
Overall, results suggest that junk bond mutual fund momentum may not support outperformance when the only asset choices are the fund and cash. However, junk bond fund momentum may support multi-asset class allocation strategies such as those described in “A Few Notes on The Ivy Portfolio”, “The Decision Moose Asset Allocation Framework” and “An Investor’s Asset Class Momentum Trading Strategy”.
In summary, evidence from simple tests suggest that junk bond mutual funds exhibit return momentum perhaps exploitable via a multi-asset class allocation strategy (but not a standalone timing strategy).
Frequently Asked Questions
What is junk bond fund momentum?
Junk bond fund momentum is the tendency of a high-yield bond fund's recent returns to persist into the following period, treating junk bonds as an asset class rather than picking individual bonds. The article tests it using the T. Rowe Price High-Yield fund (PRHYX), measuring past six-month total return against next-month return from September 1990 through July 2010.
Does momentum timing beat buy-and-hold for junk bond funds?
Momentum timing of junk bond funds roughly matches or slightly underperforms buy-and-hold when the only choices are the fund (PRHYX) and cash. Using a 0% past six-month return threshold, switching did not outperform, though thresholds of 3-5% marginally beat buy-and-hold. Results ignore trading frictions and taxes, and the best threshold would not be known in real time.
How do you test momentum in a junk bond mutual fund?
Momentum in a junk bond fund was tested by relating PRHYX's total return next month to its total return over the past six months, using monthly dividend-adjusted closes across 239 months (September 1990 to July 2010). The article also ranked past returns into terciles (77-78 observations each) and compared $100,000 invested in buy-and-hold versus a strategy holding the fund when past six-month return is positive and T-bills when negative. Trades were assumed at month ends with no frictions or taxes.
Is junk bond fund momentum better suited to multi-asset allocation than to standalone timing?
Junk bond fund momentum appears more suited to multi-asset class allocation strategies than to a standalone fund-versus-cash timing strategy. The article found switching between PRHYX and cash did not clearly beat buy-and-hold, yet tercile results supported the existence of momentum in junk bonds. It suggests the momentum may be exploitable within multi-asset frameworks such as asset class momentum strategies.
What are the limitations of using past returns to time junk bond funds?
Past returns explain little of next-month junk bond fund returns: the six-month correlation with PRHYX was 0.14 and R-squared 0.02 (2%), and adding a skip-month cut these to 0.03 and 0.00. The sample has only 40 non-overlapping six-month intervals with extreme volatility in late 2008 to early 2009, so reliability is limited; excluding April 2009 raised R-squared to 0.04. Calculations also assume month-end trading at known closing prices, which is problematic for mutual funds, and ignore trading costs and taxes.