Extended stock market index winning and losing streaks elicit speculation about pending reversals. Does evidence support the what-goes-up-must-come-down view that likelihood of reversal grows with streak duration and magnitude? To check, we examine the “modern” (since 1990) behaviors of the S&P 500 Index and NASDAQ Composite Index during the one and two trading days after winning and losing streaks of at least three days. Using daily closes, highs and lows for the S&P 500 Index and the NASDAQ Composite Index during January 1990 through June 2016 (6,681 trading days), we find that:
Testing assumptions are:
- Base future returns on the same index closes used for streak tabulations. In other words, a trader would have to determine streak status just before the close so that any associated trade takes place at the same close.
- Ignore overlap of streaks. For example, the first three days of all four-day streaks are included among three-day streaks. An investor could not know when a streak will end.
- Ignore trading frictions.
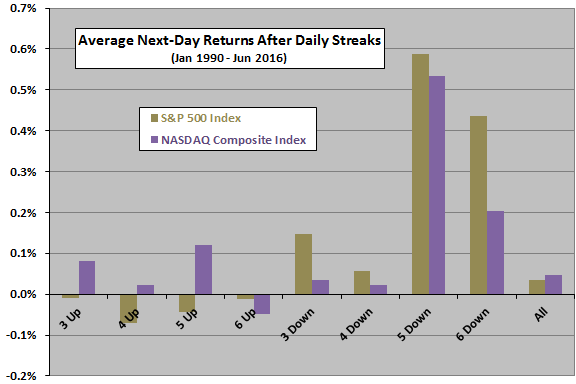
The following chart summarizes average S&P 500 Index and NASDAQ Composite Index next-day returns after up and down streaks of three to six days, and for all days, over the entire sample period. Samples of streaks longer than six days are small. Notable points are:
- For the S&P 500 Index, there is evidence of small reversals after up streaks and larger reversals after down streaks. The magnitude of reversal does not vary systematically with streak length.
- For the NASDAQ Composite Index, there is evidence of reversals only after long down streaks.
Most effects are small compared to trading frictions (which are likely larger after down streaks than up streaks due to widened bid-ask spreads).
For additional insight, we look at S&P 500 Index streak behavior in more detail.
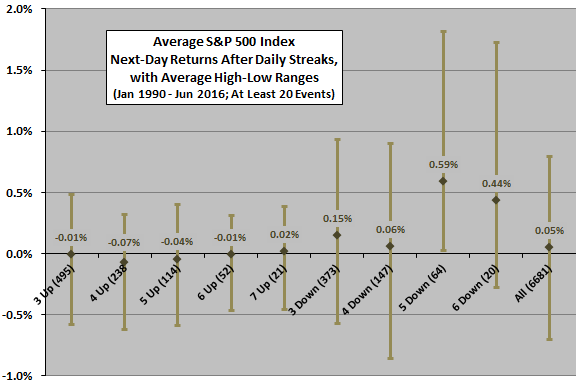
The next chart summarizes S&P 500 Index behaviors after up and down streaks for which there are at least 20 observations during the sample period, including:
- Number of observations (in parentheses on the horizontal axis).
- Average next-day return (data labels).
- Range of next-day returns measured from the prior close to next-day highs and lows (illustrated by variability ranges).
Notable findings are:
- As noted above, there is evidence of weak reversals after up streaks and stronger reversals after down streaks, but sample sizes are modest for the strongest of the latter.
- Ranges of next-day returns are much wider after down streaks than up streaks (market volatility is higher after down streaks).
- Ranges of next-day returns are skewed downward (unskewed or skewed upward) after up (down) streaks.
Do cumulative returns during streaks affect likelihood and magnitude of reversals?
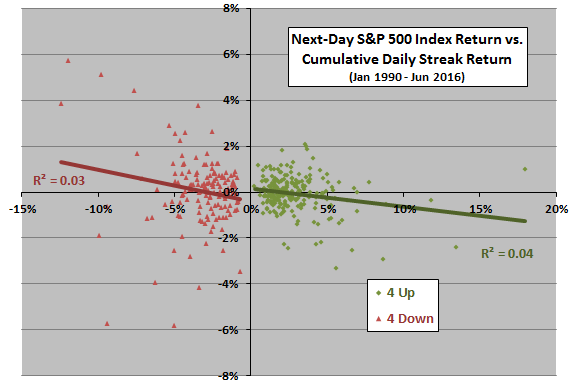
The following scatter plots relate S&P 500 Index next-day returns to cumulative returns during preceding 4-day up streaks (green diamonds) and 4-day down streaks (red triangles). Both relationships are negative, so the larger the magnitude of the cumulative return during the streak, the larger the magnitude of the next-day reversal.
However, the plots exhibit considerable dispersions and R-squared statistics indicate that cumulative return magnitudes explain only 3%-4% of next-day return magnitudes.
In summary, evidence from simple tests offers little support for belief that U.S. equity markets react reliably and exploitably after daily winning and losing streaks.
Cautions regarding findings include:
- As noted, sample sizes are very small for long streaks, limiting confidence in associated findings (and, in any case, offering only rare trades).
- Results may differ for other kinds of assets.
- To the extent that return distributions are wild (plausibly more so around streaks), normal statistics lose power as predictors.