The middle of the year might be a time for funds to dress their windows and investors to review and revise portfolios. The 4th of July celebration might engender optimism among U.S. investors. Are there any reliable patterns in daily U.S. stock market returns around mid-year and the 4th of July? To check, we analyze historical behavior of the S&P 500 Index from five trading days before through trading days after both the end of June and the 4th of July. Using daily closing levels of the index for 1950-2025, we find that:
The following chart shows average daily S&P 500 Index returns from five trading days before (days -5 to -1) to five trading days after (days 1 to 5) the end of June over the full sample period, with one standard deviation variability ranges. Results suggest some strength around the mid-year point, but variability is large compared to any anomalies.
To check the reliability of this pattern, we look at subsamples.
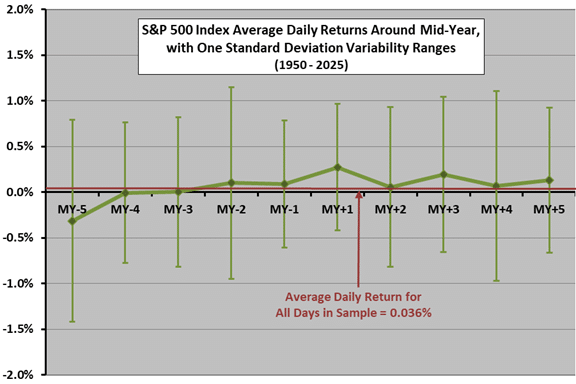
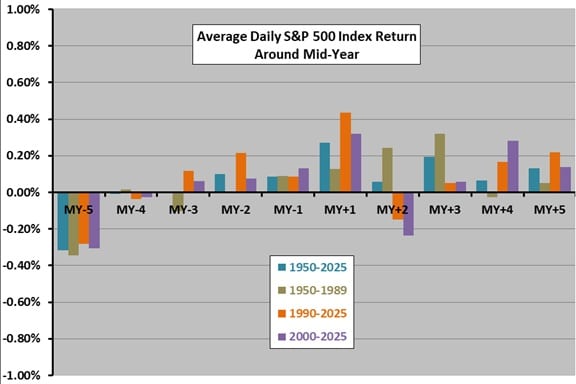
The next chart compares the average daily S&P 500 Index returns from five trading days before to five trading days after the end of June for the full sample period and several subperiods. This chart has no variability ranges and uses a finer vertical scale than the preceding one. Results generally confirm some strength around mid-year, but inconsistencies across subperiods undermine belief in pattern reliability. Over the full sample period, average daily return during these ten days is 0.058%, compared to 0.036% for all days since 1950.
Subperiods are short for reliable inference.
To distinguish any mid-year effect from that for the July 4th holiday, we re-center daily returns on the holiday (which falls one to three trading days after mid-year).
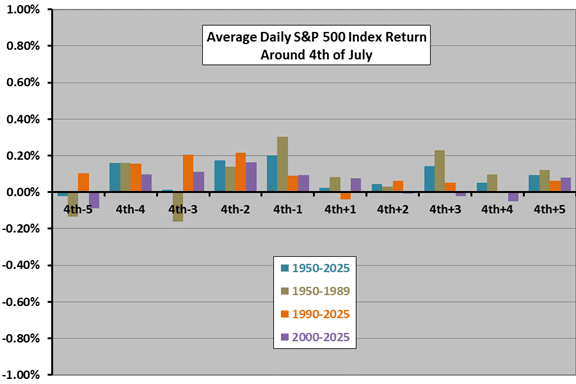
The final chart shows average daily S&P 500 Index returns from five trading days before to five trading days after the 4th of July over the full sample period and several subperiods. Results suggest mostly strength around the holiday. Over the full sample period, average daily return during these ten days is 0.088%, compared to 0.036% for all days since 1950.
Inconsistencies in results across subperiods undermine belief in reliably anomalous market behavior around the holiday.
Again, subperiods are short for reliable inference.
In summary, best guess for the U.S. stock market is modest positive bias around the mid-year point through the 4th of July holiday.
Cautions regarding the finding include:
- As noted, any return anomaly is small compared to return variability, so experience by year varies widely.
- As noted, subperiods are short for reliable inference.
- To the extent that the distribution of daily S&P 500 Index returns is wild, interpretation of the average return and standard deviation of returns breaks down.