
Is aggregate equity investor fear multifaceted? In the August 2010 version of his paper entitled “The Equity Fear Premium and Daily Comovements of the S&P 500 E/P ratio and Treasury Yields before and during the 2007 Financial Crisis”, Christophe Faugère introduces a Total Fear Premium derived from independent flight-to-safety and flight-to-liquidity impulses. The flight-to-safety component assumes investors fleeing stocks buy long-term Treasuries, driving the real, after-tax yield on Treasury bonds below long-term trend (growth rate of real Gross Domestic Product per capita). The flight-to-liquidity component assumes investors fleeing stocks buy short-term instruments (such as Treasury bills), driving their yields below the federal funds target rate. Using daily levels of the S&P 500 forward earnings yield, Treasury yields and S&P 500 Index implied volatility (VIX) over the period July 2004 through February 2010, he finds that:
- The relationship between the S&P 500 forward earnings yield and U.S. Treasury yields changes abruptly at the beginning of the financial crisis in late 2007, switching from a roughly equal mix of positive and negative comovements to mostly negative comovements, especially for long-term instruments. Concentrations of negative comovements occur:
- Mid-June 2007, at the onset of the subprime crisis.
- December 2007, the official beginning of recession.
- Mid-September to late October 2008.
- Correlations between the Total Fear Premium and VIX are strong during both the July 2004 through June 2007 pre-crisis and the July 2007 through February 2010 crisis subperiods (see the chart below).
- The Total Fear Premium is arguably a purer measure of fear in equity markets than VIX, because VIX indicates both upside and downside volatility.
The following chart, taken from the paper, compares the Total Fear Premium and VIX during July 2004 through February 2010 (both normalized to a value of 1 at the beginning). About June 2007, the two measures appear to synchronize after mirroring each other for several years. After about mid-2009, mirroring appears to resume. A possible explanation for differences is that VIX accounts for both upside and downside volatility, while the Total Fear Premium focuses on downside risk. During much of the financial crisis, especially its onset, downside volatility dominates VIX.
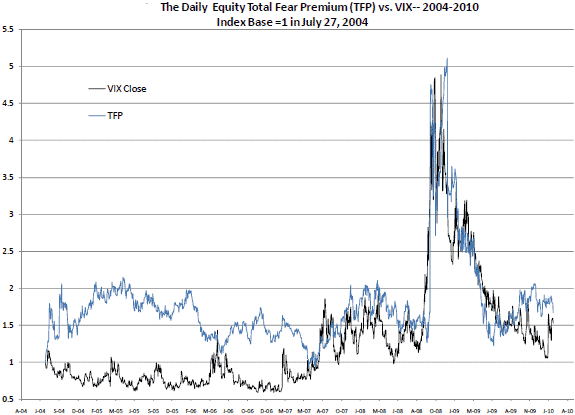
In summary, the Total Fear Premium derived from unusual and independent depressions of the yields of short-term and long-term Treasuries may be useful in assessing, separately from VIX, the level of fear among equity investors.
This Total Fear Premium is an extension of the fear premium applied to value the S&P 500 Index in “Required Yield Theory of Asset Valuation”.