Two-regime style switching (momentum in low-volatility, value in high-volatility regimes) outperformed consistent styles (1927-2004 out-of-sample backtest; regime identification via multivariate model).
Do returns associated with the four famous factors (market, size, book-to-market, momentum) vary systematically with the state of the market (such as bull or bear)? In their January 2009 paper entitled “The Effect of Market Regimes on Style Allocation”, Manuel Ammann and Michael Verhofen investigate how returns for the four factors differ between market states as determined by a multivariate two-state model of the overall equity market. Using U.S. stock market and factor data spanning 1927-2004, they conclude that:
There are two reasonably distinct overall equity market regimes with different mean returns and volatilities: low-volatility and high-volatility. Market volatility is 2.6 times higher for the latter regime than for the former.
The low-volatility regime, occurring about three quarters of the time, relates to high annual returns for the overall equity market (10.2%) and momentum stocks (12.4%), and low annual returns for small capitalization stocks (1.9%) and value stocks (2.6%).
The high-volatility regime, occurring about one quarter of the time, relates to low annual returns for the overall equity market (0.4%), momentum stocks (-1.3%) and small capitalization stocks (3.1%) and high annual returns for value stocks (15.2%).
An out-of-sample backtest indicates that switching styles according to market regime can be profitable. Specifically, momentum investing during the low-volatility regime and value investing during the high-volatility regime outperforms consistently and to a degree that appears profitable after accounting for transaction costs.
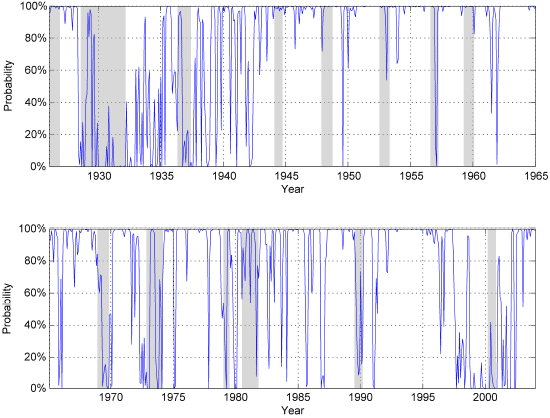
The following chart, taken from the paper, shows the modeled probability of the U.S. stock market being in the low-volatility regime during 1927-2004, with shaded areas corresponding to National Bureau of Economic Research recessions. The probability of being in the low-volatility regime is about 75% over the entire sample period. However, this probability rises (falls) to about 80% (55%) during economic expansions (recessions). The low-volatility regime favors momentum investing, while the complementary high-volatility regime favors value investing.
It seems reasonable to assume that the U.S. equity market is currently in the high-volatility regime.
In summary, equity investors may want to alternate between momentum and value investing styles as the overall stock market varies from low-volatility to high-volatility states.
Growth-inflation Regimes and Asset Class Returns PremiumClaude-generated charts of annual SPY, TLT, VNQ, GLD and DBC returns across four growth-inflation regimes show no obvious patterns; stagflation favored TLT and GLD…
Regime-Optimal Trend Following PremiumRegime-dependent optimal allocation (OPT) improved gross Sharpe ratios versus conventional time series momentum in both 2-regime and 4-regime models (U.S. equities from 1926, 14…
Tactical Signals from a Gold/Silver Ratio? PremiumGLD/SLV:SMA12 switching (hold SLV when the GLD/SLV price ratio is above its 12-month SMA, else GLD; monthly) showed higher gross CAGR than GLD, with…
Gold Price Regime Changes? PremiumGold showed -0.02 average and 0.20 maximum 10-year rolling monthly return correlation with the S&P 500 Index (Jan 1975–Mar 2025); gold ETF demand correlates…