
How much of the variation in stock returns flows from actual (realized or backward-looking) and implied (forward-looking) market volatilities? In the January 2010 version of his paper entitled “Option Implied Volatility Factors and the Cross-Section of Market Risk Premia”, Junye Li investigates the effectiveness of a three-factor model of stock returns based on market return (beta), diffusion volatility (moderate and persistent component) and jump volatility (large and mean-reverting component). The author also examines how the value premium and size effect relate to the two volatility factors and how relying only on realized market volatility affects results. Using weekly (Wednesday) data for the S&P 500 Index, S&P 500 Index options (filtering out options with extremely long/short durations, extreme moneyness and low activity) and the S&P 500 Volatility Index (VIX) spanning January 1997 through September 2008 (608 weeks), he concludes that:
- In general, higher (lower) market volatility factors based on both realized and implied volatilities relate to lower (higher) returns for individual stocks. In other words, assets with high sensitivity to these market volatility factors tend to command high risk premiums. The regression-derived impact of diffusion volatility (-0.73%) is larger and statistically more significant than that of the jump volatility factor (-0.22%), indicating that investors fear persistent volatility more than volatility shocks.
- Using market volatility factors derived from both realized and implied volatilities, the value premium relates mainly to the diffusion factor, while the size effect relates to both market volatility factors. On average:
- The diffusion volatility risk premium is 0.54% (0.12%) per month on value (growth) stocks.
- The diffusion volatility risk premium is 0.40% (0.09%) per month on small (big) stocks
- The jump volatility risk premium is 0.12% (-0.01%) per month on small (big) stocks.
- Results based only on realized (backward-looking) volatility differ from those based on both realized and implied volatilities, sometimes conflicting and often statistically insignificant.
The following figure, taken from the paper, compares the diffusion and jump market volatility factors, extracted from S&P 500 Index options and VIX, over the entire sample period. Results suggest that the two components of market volatility should affect investors differently. The jump volatility factor spikes during the Asian financial crisis, the Russian financial crisis and the failure of Long-Term Capital Management.
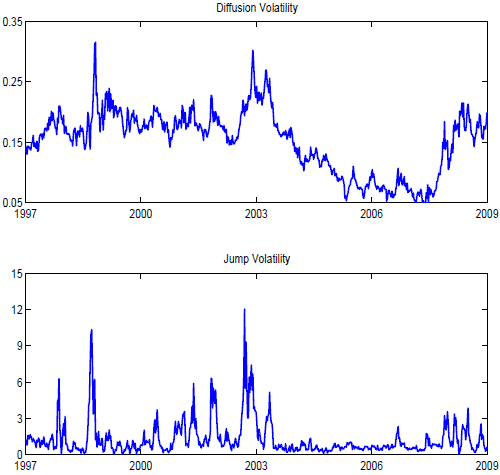
In summary, evidence suggests that investors may be able to exploit market volatility derived from forward-looking (implied volatility) measures, especially the persistent diffusion volatility component.
Frequently Asked Questions
What are diffusion volatility and jump volatility in a market volatility factor model?
Diffusion volatility and jump volatility are the two components of market volatility in Junye Li's three-factor model, alongside market return (beta). Diffusion volatility is the moderate, persistent component, while jump volatility is the large, mean-reverting component. The model uses both to explain variation in stock returns.
Do market volatility factors predict lower stock returns?
Market volatility factors based on realized and implied volatilities relate to lower returns for individual stocks when volatility is higher, and assets highly sensitive to these factors command higher risk premiums. In the January 1997–September 2008 sample, diffusion volatility had an impact of -0.73% and jump volatility -0.22%. Diffusion volatility was larger and statistically more significant, suggesting investors fear persistent volatility more than volatility shocks.
How are diffusion and jump volatility factors extracted from S&P 500 options and the VIX?
Junye Li derived the diffusion and jump volatility factors from S&P 500 Index options and the VIX, combined with realized volatility, using weekly (Wednesday) data from January 1997 through September 2008 (608 weeks). Options with extremely long or short durations, extreme moneyness and low activity were filtered out. The factors were then tested in regressions explaining the cross-section of stock returns.
Is realized volatility as useful as implied volatility for explaining stock returns?
Realized (backward-looking) volatility alone is less useful than combining it with implied (forward-looking) volatility. Results based only on realized volatility differed from those using both measures, sometimes conflicting and often statistically insignificant. The evidence suggests investors may be able to exploit forward-looking implied volatility measures, especially the persistent diffusion component.
What are the limitations of using a volatility factor model to explain value and size premiums?
The volatility factor model's findings rest on a limited sample of weekly S&P 500 data from January 1997 through September 2008 (608 weeks), and results depend on using both realized and implied volatility. The value premium relates mainly to the diffusion factor, while the size effect relates to both factors, so explanatory power differs by anomaly. Realized-only results were often statistically insignificant or conflicting, and the jump factor's effect was weaker and less significant than the diffusion factor's.