
Are there ways to concentrate the predictive power of accruals for future individual stock and equity market returns? Two recent papers explore potential refinements. In the January 2010 draft of their paper entitled “Predicting Stock Market Returns with Aggregate Discretionary Accruals”, Qiang Kang, Qiao Liu and Rong Qi focus on whether aggregate discretionary accruals (distinguished from normal accruals) are a better predictor of stock market returns than aggregate total accruals. In their February 2010 paper entitled “Percent Accruals”, Nader Hafzalla, Russell Lundholm and Matt Van Winkle investigate scaling firm-level accruals by earnings rather than total assets to predict returns for individual stocks. These studies conclude that:
In “Predicting Stock Market Returns with Aggregate Discretionary Accruals”, the authors decompose aggregate accruals scaled by total assets into aggregate normal accruals (reflecting general business conditions) and aggregate discretionary accruals (most likely characterizing managerial earnings manipulation). Using balance sheet data for a broad sample of non-financial U.S. firms with December year-ends and equity market returns over the period 1965-2004, they find that:
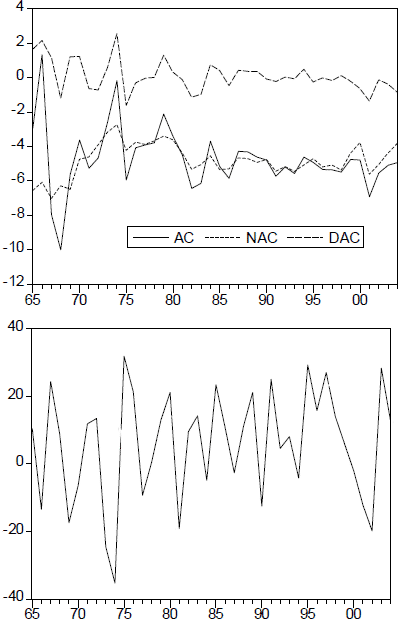
- Aggregate discretionary accruals drive the positive relationship between aggregate accruals and next-year equity market returns. An increase of one standard deviation in aggregate discretionary accruals predicts a 5.6% increase in next-year market return.
- The power of aggregate discretionary accruals to predict future market returns is robust across subperiods return/accrual measurement methods and business conditions.
- Results support the hypothesis of “lean-against-wind” aggregate earnings management, meaning that managers tend to adjust earnings upward (downward) via discretionary accruals when the equity market falls (rises).
- While aggregate discretionary accruals relate positively to future stock market returns, firm-level discretionary accruals relate negatively to individual stock returns. Moreover, firm-level discretionary accruals are predictive only for certain styles (large and growth) and sectors. Firms may manage earnings differently in response to firm-specific and and market-wide shocks, with the former responses canceling with aggregation. Also, speculators can quickly arbitrage mispricing at the firm level but not so quickly at the market level.
The following charts, extracted from the paper, plot the behaviors of Aggregate Accruals (AC), Aggregate Normal Accruals (NAC) and Aggregate Discretionary Accruals (DAC) in the upper chart and equity market returns in the lower chart over the entire sample period. Discretionary accruals are a function of total accruals, change in annual revenue and fixed assets. The study scales firm accruals as a percentage of average total assets over the prior fiscal year, excludes extreme firm accruals and calculates aggregate accruals on value-weighted basis according to market capitalization at the beginning of the fiscal year.
In summary, evidence indicates that discretionary (but not non-discretionary) aggregate accruals scaled to total assets significantly predict next-year equity market returns.
In “Percent Accruals”, the authors propose scaling accruals by earnings (percent accruals) rather than total assets to predict future returns for individual stocks, hypothesizing that investors tend to fixate on reported earnings and fail to distinguish between accruals and cash flows. An extreme observation of percent accruals is one for which accruals comprise a large positive or negative fraction of total earnings. Using income statement and return data for a broad sample of non-financial U.S. stocks spanning 1989-2008 (81,526 firm-years), they find that:
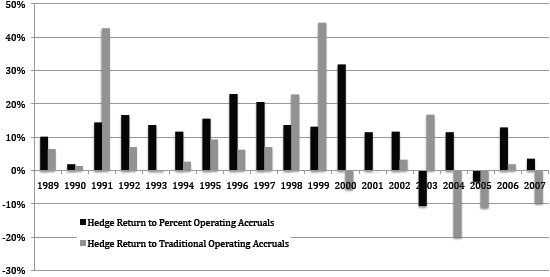
- A hedge portfolio that is long (short) the 10% of stocks with the lowest (highest) percent operating accruals, reformed annually, generates an average annual return of 11.7% (excluding trading frictions) over the entire sample period. The return comes about equally from the long (5.5%) and short (6.2%) sides. This portfolio substantially outperforms a comparable one based on accruals scaled to total assets, mostly on the long side (5.5% versus 1.3%). See the chart below for year-by-year returns.
- Results for percent total accruals are less strong.
- The 10% of firms with the lowest percent operating accruals (total asset-scaled accruals) have an average market capitalization of $1.5 billion ($474 million), suggesting lower trading frictions for strategies based on percent accruals.
- Unlike total asset-scaled accruals, percent accruals predict stock returns whether there are special items or not and whether earnings are positive or negative.
- Extreme combinations of operating cash flow and accruals, as identified by percent accruals, produce the largest differences between a sophisticated income forecast (distinguishing cash flow from accruals) and a naive forecast. Results therefore suggest that fixation by naive investors on earnings drives the percent accruals firm-level anomaly.
The following chart, taken from the paper, compares returns by year for size-adjusted hedge portfolios that are long (short) the 10% of stocks with the lowest (highest), reformed annually, based on percent operating accruals and on total asset-scaled (traditional) accruals. Annual returns for the portfolio based on percent accruals wins in 15 of 19 years.
In summary, evidence indicates that accruals scaled to earnings have substantially stronger and more consistent predictive power for future individual stock returns than accruals scaled to total assets.
Frequently Asked Questions
What are accruals in accounting and why do investors care about them?
Accruals are the non-cash portion of reported earnings, and investors watch them because they appear to predict future stock returns. The article examines two refinements: aggregate discretionary accruals, which are accruals attributed to likely managerial earnings manipulation rather than general business conditions, and percent accruals, which scale accruals by earnings instead of total assets. Both aim to concentrate the predictive power of accruals.
Do aggregate discretionary accruals predict stock market returns?
Aggregate discretionary accruals do predict next-year equity market returns, with a one standard deviation increase forecasting a 5.6% higher market return over 1965-2004. The predictive power is robust across subperiods, return and accrual measurement methods, and business conditions. Discretionary accruals, not non-discretionary (normal) accruals, drive the relationship between aggregate accruals and future market returns.
How is a percent accruals trading strategy constructed and tested?
A percent accruals strategy scales firm accruals by earnings rather than total assets, then goes long the 10% of stocks with the lowest percent operating accruals and short the 10% with the highest, reformed annually. The test used income statement and return data for non-financial U.S. stocks over 1989-2008 (81,526 firm-years). The hedge portfolio averaged 11.7% per year before trading frictions, with 5.5% from the long side and 6.2% from the short side.
How do percent accruals compare to traditional asset-scaled accruals for predicting stock returns?
Percent accruals outperform traditional accruals scaled by total assets for predicting individual stock returns. The long side returned 5.5% versus 1.3% for the asset-scaled approach, and the percent accruals portfolio won in 15 of 19 years. Unlike asset-scaled accruals, percent accruals predict returns whether or not special items exist and whether earnings are positive or negative.
What are the limitations of using discretionary accruals to predict stock returns?
Discretionary accruals predict returns differently at the market and firm levels, which limits their use. Aggregate discretionary accruals relate positively to future market returns, but firm-level discretionary accruals relate negatively to individual stock returns and are predictive only for certain styles (large and growth) and sectors. Also, the 11.7% percent accruals return excludes trading frictions, so real-world results would be lower.