
Does the new Fama-French five-factor model of stock returns explain a wider range of anomalies than the workhorse Fama-French three-factor model. In the June 2015 update of their paper entitled “Dissecting Anomalies with a Five-Factor Model”, Eugene Fama and Kenneth French examine the power of their five-factor model of stock returns to explain five anomalies not explicitly related to the five factors model and known to cause problems for the three-factor model (market beta, net share issuance, volatility, accruals, momentum). The five-factor model adds profitability (robust minus weak, or RMW) and investment (conservative minus aggressive, or CMA) factors to the three-factor model (market, size and book-to-market factors). The size, book-to-market, profitability and investment factor portfolios are reformed annually using data that are at least six months old (in contrast, the momentum factor portfolio is reformed monthly). Using data for a broad sample of U.S. firms and associated stocks during July 1963 through December 2014, they find that:
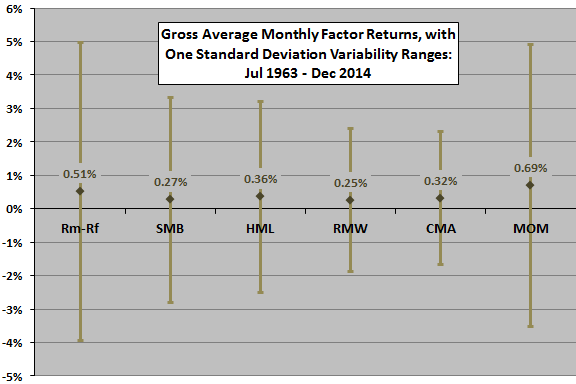
- Over the entire sample period, returns for all factors in the five-factor model and for the momentum factor are more than two standard errors greater than zero (see the chart below).
- The five-factor model explains more anomalies than the conventional three-factor anomaly. Specifically:
- Positive exposures to the RMW and CMA factors capture the high average returns of portfolios comprised of stocks with low market beta, net share repurchases and low volatility (indicating profitable firms that invest conservatively).
- Conversely, negative RMW and CMA exposures help explain the low average returns of portfolios comprised of stocks with high market beta, large share offerings and high volatility (indicating unprofitable firms that invest aggressively) .
- However, like the three-factor model, the five factor model does not explain the accruals and momentum anomalies. For accruals, the five-factor model does worse than the three-factor model.
The following chart, constructed from data in the paper, summarizes gross average monthly returns and variability ranges for each of the factors in the five-factor model, plus the momentum factor. The factors are:
- Rm-Rf (market) – value-weighted market returns minus the risk-free rate (one-month U.S. Treasury bill yield).
- SMB (size) – returns for a portfolio that is long (short) small-capitalization (big-capitalization) stocks.
- HML (value) – returns for a portfolio that is long (short) stocks with high (low) book-to-market ratios.
- RMW (profitability) – returns for a portfolio that is long (short) stocks with robust (weak) profitability.
- CMA (investment) – returns for a portfolio that is long (short) stocks with conservative (aggressive) investment in new assets.
- MOM (momentum) – returns for a portfolio that is long (short) stocks with high (low) past returns.
A simple interpretation of these results is that the momentum and investment factors are most reliable, and the size factor is least reliable. However, these returns are gross. The momentum factor portfolio, reformed monthly rather than annually, would carry much higher trading frictions than the other factor portfolios.
In summary, the Fama-French five-factor model (unlike their conventional three-factor model) explains stock return anomalies associated with market beta, net share issuance and volatility, but still fails to explain accruals and momentum anomalies.
Cautions regarding findings include:
- Factor models employ gross, not net, returns. Incorporating costs of period portfolio reformation and costs of shorting (if shorting of specified stocks is feasible) would reduce factor returns. From a factor premium capture perspective, factor returns that imply high turnover (such as momentum) are not comparable to factor returns that imply low turnover (such as value).
- Factor returns depend on factor definitions, the specified ways of selecting and sorting stocks to define the long and short sides of factor portfolios. Changing the definitions may change findings.
- Constructing factor models via experimentation introduces data snooping bias, thereby overstating the power of the best models to predict returns. However, the authors assert that adding the profitability and investment factors to the three-factor model is fundamentally justified.
See also “Better Four-factor Model of Stock Returns?”.
Frequently Asked Questions
What is the Fama-French five-factor model of stock returns?
The Fama-French five-factor model is an asset pricing model that explains stock returns using five factors: market, size (SMB), book-to-market value (HML), profitability (RMW) and investment (CMA). It extends the three-factor model (market, size, value) by adding profitability, defined as robust minus weak, and investment, defined as conservative minus aggressive. The size, value, profitability and investment portfolios are reformed annually.
Does the five-factor model explain stock return anomalies better than the three-factor model?
The Fama-French five-factor model explains more anomalies than the three-factor model, specifically those tied to market beta, net share issuance and volatility, in U.S. stock data from July 1963 to December 2014. It still fails to explain the accruals and momentum anomalies, and for accruals it does worse than the three-factor model.
How do the profitability and investment factors in the five-factor model capture anomalies like low volatility and share buybacks?
The five-factor model captures these anomalies through portfolio exposures to the RMW (profitability) and CMA (investment) factors. Positive RMW and CMA exposures account for the high average returns of low-beta, net-repurchase and low-volatility stocks, which tend to be profitable firms that invest conservatively. Negative exposures explain the low returns of high-beta, large-share-offering and high-volatility stocks, which tend to be unprofitable firms that invest aggressively.
Are momentum and value factor returns comparable in terms of reliability and trading costs?
Momentum and value factor returns are not directly comparable because momentum portfolios are reformed monthly while value portfolios are reformed annually. In the 1963-2014 sample, the momentum and investment factors looked most reliable and the size factor least reliable on gross returns. Momentum's high turnover would carry much higher trading frictions than the other factors.
What are the limitations of the Fama-French five-factor model and its backtested factor returns?
The five-factor model's reported factor returns are gross, so costs of portfolio reformation and shorting would reduce them. Results also depend on how factors are defined and how stocks are sorted, so changing definitions may change findings. Building factor models through experimentation introduces data snooping bias that overstates predictive power, although the authors argue the profitability and investment factors are fundamentally justified.