Governments are largely insulated from market forces. Companies are not. Investments in stocks therefore carry substantial risk in comparison with holdings of government bonds, notes or bills. The marketplace presumably rewards risk with extra return. How much of a return premium should investors in equities expect? These blog entries examine the equity risk premium as a return benchmark for equity investors.
Are low volatility stock strategies, as implemented by exchange-traded funds (ETF), attractive? To investigate, we consider eight of the largest low volatility ETFs, all currently available, in order of longest to shortest available histories:
Invesco S&P 500 Low Volatility Portfolio (SPLV) – the 100 stocks from the S&P 500 Index with the lowest realized volatility over the past 12 months, reformed quarterly. The benchmark ETF for SPLV is SPDR S&P 500 (SPY).
iShares Edge MSCI Min Vol USA (USMV) – seeks to track an index composed of U.S. equities that, in the aggregate, have lower volatility characteristics relative to the broader U.S. equity market. The benchmark ETF for USMV is iShares Russell 3000 (IWV).
iShares Edge MSCI Min Vol EAFE (EFAV) – seeks to track an index composed of developed market equities that, in the aggregate, have lower volatility characteristics relative to the broader developed equity markets, excluding the U.S. and Canada. The benchmark ETF for EFAV is iShares MSCI EAFE Index (EFA).
iShares Edge MSCI Min Vol Global (ACWV) – seeks to track an index composed of developed and emerging market equities that, in the aggregate, have lower volatility characteristics relative to the broader developed and emerging equity markets. The benchmark ETF for ACWV is iShares MSCI ACWI (ACWI).
Invesco S&P International Developed Low Volatility Portfolio (IDLV) – the 200 least volatile stocks of the S&P Developed excluding U.S. and South Korea LargeMid Cap BMI Index over the past 12 months, reformed quarterly. The Index is computed using net return, which withholds taxes applicable to non-resident investors. The benchmark ETF for IDLV is Vanguard FTSE All-Wld ex-US ETF (VEU).
Invesco S&P MidCap Low Volatility Portfolio (XMLV) – the 80 out of 400 medium-capitalization stocks from the S&P MidCap 400 Index with the lowest realized volatility over the past 12 months, reformed quarterly. The benchmark ETF for XMLV is SPDR S&P MidCap 400 (MDY).
Are exchange-traded funds (ETF) focused on Initial Public Offerings of stocks (IPO) attractive? To investigate, we consider three of the largest IPO ETFs and one recent Special Purpose Acquisition Company (SPAC) ETF, one of which is no longer available, in order of longest to shortest available histories:
Renaissance IPO ETF (IPO) – reflects approximately the top 80% of new public firms weighted by free float capitalization with a 10% cap for any one position. Large IPOs enter quickly and others enter during quarterly reviews. All exit two years after initial trade date.
Defiance Next Gen SPAC Derived ETF (SPAK) – 60% weight to IPOs derived from SPACs and 40% weight to common stock of newly listed SPACs, excluding warrants (dead as of the end of August 2022).
How do exchange-traded-funds (ETF) that employ artificial intelligence (AI) to pick assets perform? To investigate, we consider ten such ETFs, eight of which are currently available:
VanEck Social Sentiment ETF (BUZZ) – picks U.S. stocks with the most positive sentiment as determined from online sources via a rules-based quantitative methodology.
WisdomTree International Al Enhanced Value Fund (AIVI) – picks developed market value stocks outside the U.S. and Canada via a quantitative AI model. [We use data only since retention of an AI-oriented advisor at the beginning of 2022.]
WisdomTree U.S. Al Enhanced Value Fund (AIVL) – picks U.S. value stocks via a quantitative AI model. [We use data only since retention of an AI-oriented advisor at the beginning of 2022.]
We use SPDR S&P 500 ETF Trust (SPY) for comparison, though it is not conceptually matched to some of the ETFs. We focus on monthly return statistics, along with compound annual growth rates (CAGR) and maximum drawdowns (MaxDD). Using monthly total returns for the ten AI-powered ETFs and SPY as available through April 2026, we find that:Keep Reading
What are current estimates of equity risk premiums (ERP) and risk-free rates around the world? In their April 2026 paper entitled “Survey: Market Risk Premium and Risk-Free Rate used for 97 countries in 2026”, Pablo Fernandez, Amir Habibian and Lucia Acin summarize results of a March-April 2026 email survey of international finance and economic professors, analysts and company managers about the risk-free rate and the Market Risk Premium (MRP) used to calculate the required return to equity in different countries. Results are in local currencies. Based on 3,637 specific and credible premium estimates spanning 97 countries for which there are at least eight estimates, they find that:Keep Reading
What are the costs of mitigating tail risk via exchange-traded funds (ETF) designed to manage it? To investigate, we consider seven such ETFs, three dead and four live, as follows:
VelocityShares Tail Risk Hedged Large Cap ETF (TRSK) – hedges against tail risk by allocating 85% (15%) of assets to ETFs that track the S&P 500 Index (a volatility component designed to hedge against extreme market declines). This ETF is dead.
Cambria Global Tail Risk ETF (FAIL) – invests at least 40% of assets in investment grade, intermediate U.S. treasuries and TIPS, at least 40% in non-U.S. sovereign bonds and about 1% per month in put options. This ETF is dead.
Cambria Tail Risk ETF (TAIL) – holds cash and U.S. government bonds and about 1% of assets per month in put options.
Global X NASDAQ 100 Tail Risk ETF (QTR) – invests at least 80% of assets in the securities of the Nasdaq-100 Quarterly Protective Put 90 Index, which holds NASDAQ 100 stocks and put options on the NASDAQ 100 Index.
Global X S&P 500 Tail Risk ETF (XTR) – invests at least 80% of assets in the S&P 500 and put options on the S&P 500 Index.
Simplify Tail Risk Strategy ETF (CYA) – invests 50%-90% of assets in income-generating ETFs and up to 20% in derivatives to hedge tail risk. This ETF is dead.
Note that TRSK, QTR, XTR and CYA are composite portfolios holding equities and embedded tail risk protection, while FAIL, TAIL and CAOS are pure tail risk protection usable as adjuncts to separate equity portfolios. We use SPDR S&P 500 ETF Trust (SPY), iShares MSCI EAFE ETF (EFA) and Invesco QQQ Trust (QQQ) over matched sample periods for reference. We focus on monthly return statistics, along with compound annual growth rates (CAGR) and maximum drawdowns (MaxDD). Using monthly total returns for the seven tail risk ETFs, SPY, EFA and QQQ as available through March 2026, we find that:
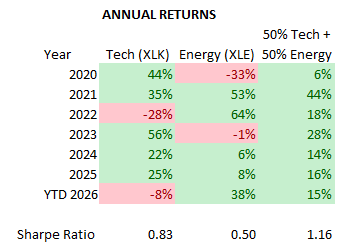
A subscriber forwarded the following chart with summary performances of State Street Energy Select Sector SPDR ETF (XLE), State Street Technology Select Sector SPDR ETF (XLK) and an equal-weighted, annually rebalanced combination of the two and encouraged further investigation. The chart indicates that XLE and XLK are materially diversifying since 2020, but the sample is extremely short and includes unusual COVID-19 and Iran war disruptors.
We extend the backtest to inceptions of XLE and XLK at both monthly and annual measurement frequencies, with respective monthly and annual rebalancing of the equal-weighted portfolio of the two ETFs (50-50). We consider statistical, cumulative and dynamic perspectives. Using month-end XLE and XLK dividend-adjusted prices during December 1998 through March 2026, we find that:Keep Reading
Much prior research indicates that most stock anomalies fail to deliver due to data snooping in their discovery, post-publication market adaptation and, especially, implementation costs. In their March 2026 paper entitled “Reviving Anomalies”, Heiner Beckmeyer, Florian Berg, Timo Wiedemann and Jonas Wortmann describe and test a framework to address the poor performance of simple long-short portfolios by double-sorting based first on anomaly rules and then on expected next-month net returns of anomaly stocks. They employ machine learning return forecasts based on 153 firm/stock characteristics to compute expected returns. They quantify expected trading frictions with impact of trading scaled by fund size (micro, small, medium and large). Using data for the 153 firm/stock characteristics and return data for a broad sample of U.S. stocks during January 2004 to December 2023, they find that:Keep Reading
How many stocks truly drive U.S. wealth creation? In his March 2026 paper entitled “One Hundred Years in the U.S. Stock Markets”, Hendrik Bessembinder computes investment outcomes for the full lifetime of each publicly listed U.S. common stock over the last 100 years in two ways:
Buy-and-Hold – compounded percentage return with dividends reinvested.
Shareholder Wealth Creation – the change in aggregate shareholder wealth while a stock is listed minus the wealth that would have accrued by instead continuously holding 1-month U.S. Treasury bills (T-bills). This measure accounts for net distributions (dividends, spinoffs, share repurchases, share issuances).
Using monthly prices and distributions for 29,754 U.S. common stocks during January 1926 through December 2025, he finds that:
In response to “Bitcoin Trend Predicts U.S. Stock Market Return?”, a subscriber suggested that bitcoin (BTC) price trend/return may be more strongly predictive of NASDAQ 100 Index (NDX) returns than of S&P 500 Index returns. To investigate, we relate BTC returns to NDX returns at daily, weekly and monthly frequencies. We rationalize the different trading schedules for these two series by excluding BTC trading dates that are not also NDX trading days. Most results are conceptual, but we test three versions of an NDX timing strategy based on prior BTC returns focused on compound annual growth rate (CAGR) and maximum drawdown (MaxDD). Using daily NDX levels and (pruned) BTC prices during 9/17/2014 (limited by the BTC series) through 3/4/2026, we find that:
What are the different ways of estimating the equity risk premium, and which one is best? In his March 2026 paper entitled “Equity Risk Premiums (ERP): Determinants, Estimation, and Implications – The 2026 Edition”, Aswath Damodaran updates a comprehensive overview of equity risk premium estimation. He examines why different approaches to estimating the premium disagree and how to choose among them. Using data from multiple countries (but focusing on the U.S.) over long periods through the end of 2025, he concludes that:Keep Reading
Become a CXO Member
Gain access to hundreds of premium investing research articles and CXO's trading strategies