
How can investors suppress the downside of trend following strategies? In their July 2019 paper entitled “Protecting the Downside of Trend When It Is Not Your Friend”, flagged by a subscriber, Kun Yan, Edward Qian and Bryan Belton test ways to reduce downside risk of simple trend following strategies without upside sacrifice. To do so, they: (1) add an entry/exit breakout rule to a past return signal to filter out assets that are not clearly trending; and, (2) apply risk parity weights to assets, accounting for both their volatilities and correlations of their different trends. Specifically, they each month:
- Enter a long (short) position in an asset only if the sign of its past 12-month return is positive (negative), and the latest price is above (below) its recent n-day minimum (maximum). Baseline value for n is 200.
- Exit a long (short) position in an asset only if the latest price trades below (above) its recent n/2-day minimum (maximum), or the 12-month past return goes negative (positive).
- Assign weights to assets that equalize respective risk contributions to the portfolio based on both asset volatility and correlation structure, wherein covariances among assets adapt to whether an asset is trending up or down. They calculate covariances based on monthly returns from an expanding (inception-to-date) window with baseline 2-year half-life exponential decay.
- Impose a 10% annual portfolio volatility target.
Their benchmark is a simpler strategy that uses only past 12-month return for trend signals and inverse volatility weighting with annual volatility target 40% for each asset. Their asset universe consists of 66 futures/forwards. They roll futures to next nearest contracts on the first day of the expiration month. They calculate returns to currency forwards using spot exchange rates adjusted for carry. Using daily prices for 23 commodity futures, 13 equity index futures, 11 government bond futures and 19 developed and emerging markets currency forwards as available during August 1959 through December 2017, they find that:
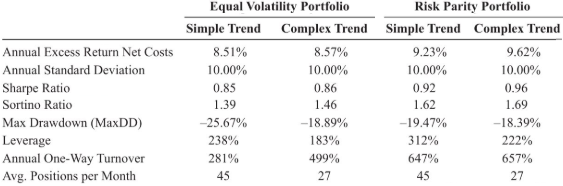
- Compared to the simple rule, the complex trend determination rules (see the table below), c:
- Generate slightly higher net average annual excess return and net annual Sharpe ratio.
- Generate modestly higher net annual Sortino ratio.
- Suffer modestly shallower maximum drawdown.
- Specify moderately lower leverage.
- Drive substantially to slightly higher portfolio turnover (and is thus more sensitive to level of trading frictions).
- Hold substantially fewer positions.
- Compared to inverse volatility, risk parity weighting (again, see the table below):
- Generates materially higher net average annual excess return and Sharpe ratio.
- Generates materially higher Sortino ratio.
- Suffers modestly to slightly shallower maximum drawdown.
- Requires higher leverage.
- Drives much higher turnover (and is thus much more sensitive to level of trading frictions).
- Results are qualitatively similar for 150 and 100 values of n, and for different half-lives in covariance calculations.
The following table, extracted from the paper, summarizes net performance statistics and characteristics of four strategies applied to the assets specified above during 1961-2017:
- Simple trend following based on sign of 12-month past return, with equal volatility weighting.
- Complex trend following based on sign of 12-month past return plus recent price channel signal, with equal volatility weighting.
- Simple trend following based on sign of 12-month past return, with risk parity weighting.
- Complex trend following based on sign of 12-month past return plus recent price channel signal, with risk parity weighting.
For equal volatility portfolios, each asset has 40% annual volatility target. For risk parity portfolios, annual portfolio volatility target is 10%. Finally, for comparison, results for all portfolios are retrospectively adjusted to 10% annual volatility. To ensure availability of required information, there is a lag of one trading day between signal and execution.
Findings suggest that complex trend rules with risk parity weighting perform best, but drive high turnover, so findings are sensitive to assumed level of trading frictions.
In summary, evidence suggests that investors can improve the performance of a simple trend following strategy by filtering trend signals with a breakout rule and using risk parity to assign asset weights.
Cautions regarding findings include:
- As demonstrated, complex trend following rules and (especially) risk parity weighting increase strategy turnover and thereby trading frictions. The level of trading frictions assumed in the study may be low for some investors, and it is very difficult to model frictions over a 57-year history. A higher level of frictions could reverse findings.
- Testing multiple strategies on the same data introduces data snooping bias, such that the best-performing strategy overstates expectations. Further snooping bias may derive from experimental selection of added strategy features (breakout rule and risk parity weighting) and experimental assignment of parameter values (return lookback interval, value of n and half-life used in covariance calculations).
- Calculating risk parity weights as specified is beyond the reach of most investors, who would bear fees for delegating to a fund manager.