
Can investors use leveraged exchange-traded funds (ETF) as building blocks for long-term portfolios? In his January 2021 presentation package entitled “One Year Later. Leveraged ETFs in Portfolio Construction and Portfolio Protection”, Mikhail Smirnov updates multi-year performance of a monthly rebalanced partially 3X-leveraged portfolio consisting of:
- 40% ProShares UltraPro QQQ (TQQQ)
- 20% Direxion Daily 20+ Year Treasury Bull 3X Shares (TMF)
- 40% iShares 20+ Year Treasury Bond ETF (TLT)
The last three years are out-of-sample with respect to specification of this portfolio. He also looks at a more conservative portfolio of 20% TQQQ and 80% TLT, rebalanced monthly. Using pre-inception simulated and actual monthly total returns for these ETFs during January 1, 2005 through January 15, 2021, he finds that:
- For the 40% TQQQ/20% TMF/40% TLT portfolio (see the chart below):
- Since mid-August 2005 (with partially simulated prices), gross average annual return is 24.5%, with annual volatility 22.8% and maximum drawdown (MaxDD) -52%.
- Since the beginning of 2013, gross average annual return is 32.0%, with annual volatility 21.8% and MaxDD -33%.
- Since the beginning of 2018, gross average annual return is 39.2%, with annual volatility 27.5% and MaxDD -33%.
- For a more conservative 20% TQQQ/80% TLT portfolio, rebalanced monthly, gross average annual return is 15.1%, with annual volatility 13.1% and MaxDD -26%.
The following chart, taken from the paper, tracks on a logarithmic scale cumulative gross value of the monthly rebalanced 40% TQQQ/20% TMF/40% TLT portfolio since the beginning of 2013, with focus on recent (post-specification) performance. Overall, the portfolio performs well post-specification, but is weak in 2018 and suffers a substantial drawdown during the COVID-19 equity market crash.
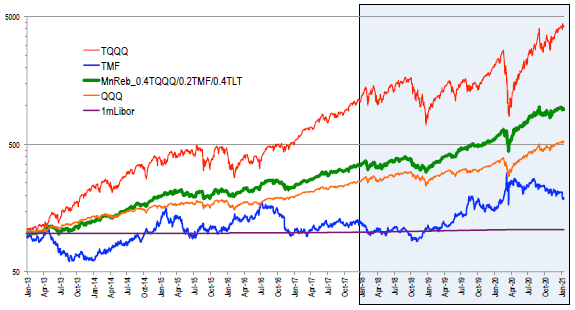
In summary, a monthly rebalanced 40% TQQQ/20% TMF/40% TLT portfolio exhibits attractive risk-adjusted performance and fairly good performance persistence over the available sample period through mid-January 2021.
Cautions regarding findings include:
- The out-of-sample subperiod is very short for reliable inference.
- Performance data ignore monthly rebalancing frictions. Frictions for TQQQ and TMF may be material (wide bid-ask spreads).
- Inserting a delay between end-of-month ETF values and rebalancing actions could affect findings.
- The available test period is historically strong for both QQQ and TLT and may not be representative of their long-term performances.
- For the in-sample part of the test period, optimization of asset allocations via experimentation introduces snooping bias .
- The high returns found are arguably not sustainable due to: (1) trade crowding pushing valuations of underlying assets higher and higher; and/or, (2) increasing resistance from counterparties to act in ways that support strategy performance.
See also “Classic Stocks-Bonds Portfolios with Leveraged ETFs”, “Managing Asset Class Exposures with Leveraged ETFs” and “Simple Asset Class Leveraged ETF Momentum Strategy”.
Frequently Asked Questions
What is a leveraged ETF and how is it used in a long-term portfolio?
A leveraged ETF is an exchange-traded fund that seeks a multiple of the daily return of an underlying asset or index, such as 3X for ProShares UltraPro QQQ (TQQQ) or Direxion Daily 20+ Year Treasury Bull 3X Shares (TMF). In the article, leveraged ETFs serve as building blocks in a monthly rebalanced portfolio of 40% TQQQ, 20% TMF and 40% unleveraged iShares 20+ Year Treasury Bond ETF (TLT).
Does a portfolio of TQQQ, TMF and TLT deliver attractive returns?
A monthly rebalanced 40% TQQQ/20% TMF/40% TLT portfolio showed attractive risk-adjusted performance, with 24.5% gross average annual return, 22.8% annual volatility and a -52% maximum drawdown since mid-August 2005 (partially simulated prices). Since the beginning of 2018, which is out-of-sample, gross average annual return was 39.2% with 27.5% volatility. The out-of-sample period is very short, so these results are not reliable evidence of future performance.
How is the performance of a leveraged ETF portfolio tested when the ETFs are relatively new?
The leveraged ETF portfolio was tested using a mix of pre-inception simulated and actual monthly total returns for the ETFs from January 1, 2005 through January 15, 2021, with the portfolio rebalanced monthly. The last three years were treated as out-of-sample relative to the portfolio specification. Performance is measured by gross average annual return, annual volatility and maximum drawdown.
How does an aggressive 40% TQQQ portfolio compare with a more conservative 20% TQQQ and 80% TLT mix?
The 20% TQQQ/80% TLT portfolio, rebalanced monthly, produced lower gross average annual return of 15.1%, annual volatility of 13.1% and maximum drawdown of -26%. The 40% TQQQ/20% TMF/40% TLT portfolio returned 24.5% with 22.8% volatility and a -52% maximum drawdown since mid-August 2005. The more aggressive mix had higher return but roughly double the drawdown.
What are the risks and limitations of using leveraged ETFs in a monthly rebalanced portfolio?
The leveraged ETF portfolio results carry several caveats: the out-of-sample period is too short for reliable inference, and performance ignores monthly rebalancing frictions, which may be material given wide bid-ask spreads for TQQQ and TMF. The test period was historically strong for both QQQ and TLT, and optimizing allocations in-sample introduces snooping bias. The high returns may also not be sustainable due to trade crowding and increasing counterparty resistance.