
Inflation Forecast
The inflation rate is a fundamental determinant of the discount rate used to calculate the present value of an asset. Changes in inflation therefore affect asset valuations. The following discussion provides forecasts for U.S. total and core (excluding food and energy) inflation rates, along with the method for constructing the forecast and the rationale for the methodology.
We update the forecast monthly as the Bureau of Labor Statistics (BLS) releases new Consumer Price Index data.
The following chart summarizes forecasts for the 12-month trailing, non-seasonally adjusted total and core inflation rates over the next year by month. The error bars indicate one standard deviation ranges above and below the forecasts based on a backtest of all forecasts since 1990.
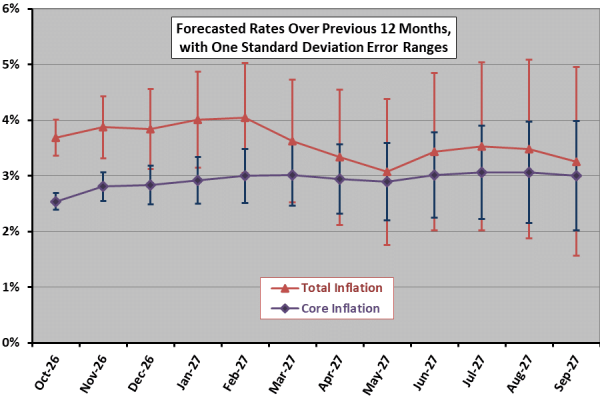
Forecasts are strictly technical, based only on past Consumer Price Index (CPI) data and not on any fundamental economic data such as trends in commodity prices, employment levels and wages. Guiding beliefs for this analysis are:
- There is probably an important degree of calendar regularity to the inflation rate, perhaps due to seasonal variation in supply of and demand for goods and services. In other words, the inflation rate for a particular month during the next 12 months is likely related more to past inflation rate behavior during that same calendar month than to inflation rates during other past months.
- For a short-term inflation rate forecast, momentum is probably more important than reversion. In other words, the inflation rate does not revert to its long-term trend quickly, and recent changes in CPI are more indicative of near-term future changes than are changes in CPI from the more distant past.
- The political cycle, and attendant economic/fiscal policy, may be significant for inflation rate behavior. In other words, inflation rate trends should consider at least four years of history and should consider history in four-year increments.
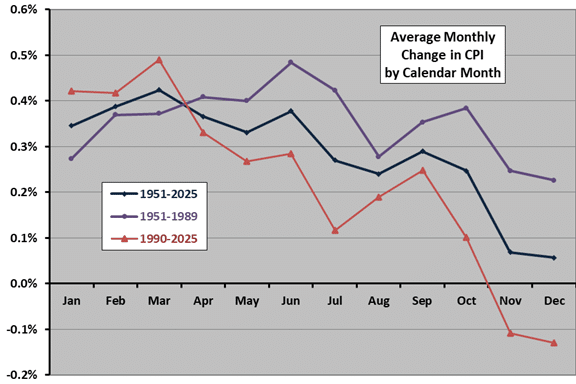
Relevant to the first point, the following chart shows how the non-seasonally adjusted CPI varies by calendar month during 1951-2024 and two subperiods, 1951-1989 and 1990-2024. Results indicate some persistence in seasonality over time, with relatively low inflation in November and December the most consistent finding.
Based on these beliefs and some sensitivity testing, we choose for our inflation rate forecast four years of historical data, with most recent data weighted more heavily than older data via a simple algorithm. So, for example, we estimate the change in CPI for next September by extrapolating the changes in CPI from the four most recent Septembers, weighting newer historical data more heavily than older data. Note that sensitivity testing is susceptible to data snooping bias.
We generate variability ranges for the total and core inflation rate forecasts by applying this methodology to each month since January 1990 and calculating the standard deviations of the differences between forecasted inflation rates and the actual inflation rates for each of forecasted months 1 through 12.
Our focus is the effect of inflation on investor valuation of stocks, which arguably involves behavioral aspects more appropriate for the volatile total inflation rate. However, the focus of the Federal Reserve Board of Governors on core measures may attract investor attention.
In summary, the above inflation forecast uses a relatively small amount of historical data to forecast the inflation rate, with more recent data weighted more heavily. Using historical inflation rate data to predict future inflation is simple and probably as effective as any reasonably manageable approach.
Cautions regarding the forecast include:
- As noted, the forecast is strictly technical, ignoring any fundamental inflation drivers.
- The body of research on inflation forecasting indicates that there is no easy, accurate method.
For some thoughts about the long-term inflation trend as driven by changes in workforce productivity and government deficit spending, see “Public Debt, Inflation and the Stock Market” and “Economic Implications of U.S. Federal Debt Trajectory”.