
Our Guru Grades section ranks a group of 29 stock market experts according to our assessments of the accuracy of their stock market forecasts. Since Jack Schannep has been in the upper tier of the list since inception, we asked him to encapsulate his thinking on market timing as a guest entry for this blog. He graciously agreed. Here is Jack Schannep on market timing:
Market Timing and Current Market Conditions
by Jack Schannep
In response to Steve LeCompte’s request that I outline my approach to market timing, I take the perspective of an investor looking at today’s stock market. The following discussion is updated from a recent letter posted for subscribers at my website, TheDowTheory.com. Some of the materials I refer to are found in the Free Area of that website and others in the Subscribers Area. I have tried to make it understandable without subscriber’s access.
How is an investor to know where we are at any given time in the stock market? Is it too late to buy? Too early to sell? Or what? Following are the steps I go through to answer these questions, and my conclusions with respect to current market conditions:
Step 1
First, I look to see where we are in the bull/bear cycle of the stock market.
We are obviously in an “official” bull market, defined as up 19% on both the Dow Jones Industrial Average and the S&P 500 index. [I identified the the market bottom in my email to subscribers of 10/9/02 entitled “Only Twice Before in 50 Years, and Now Today” and highlighted the date this bull market became official in my letter to subscribers of 11/27/02.] We have not transitioned to a bear market, defined as down 16% on both indices.
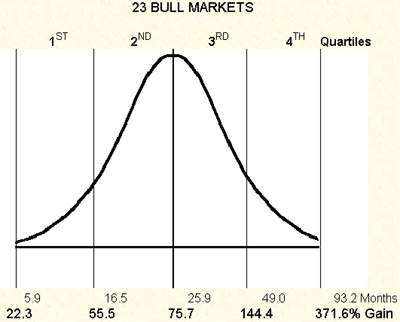
The following chart, from the Bell Curves of Bull and Bear Markets page in the Free Area of my website, shows the rough distribution of past bull markets by both size of gain and longevity. Based on the 56% gain by the Dow and the 69% gain by the S&P 500 for the current bull market, we are only in the 2nd quartile of bull markets in terms of gains. Based on current bull market longevity at 42 months, we are in the 3rd quartile of bull markets with respect to longevity.
So, as the talking heads like to say, this bull market is a little “long in the tooth.” However, seven of the last eight bull markets that lasted 36 months went on to last at least 48 months, so the odds are good that the current bull market will last into October 2006 for its fourth anniversary. The average gain in the fourth year of past bull markets is 20%. As we approach the half-way point of the fourth year of the current bull market, the market is up 10%, with less than 4% further to go to surpass the Dow’s all-time high of 11,723.
So, it would seem that it IS late, but not TOO late. It is a little early to be selling, but not TOO early to be THINKING about selling. Hey, no bull market lasts forever! Of the last seven bull markets that made it to their fourth anniversary, over half (four of seven) ended between their 49th and 61st months, implying the end of the current bull market sometime between October 2006 and October 2007. Only three of the 25 bull markets of the 20th-21st centuries lasted longer.
Step 2
Second, I look to see where we are in the economic cycle of expansions and recessions.
We are obviously in an expansion. When will it end? Presently, two of the three indicators of our “Three Tops and a Tumble” model appear to have “topped”: (1) volume in November 2005; and, (2) yield curve flattening in January, February and March 2006. Volume could very well go higher, and should if this market has further to advance. Our third topping indicator, consumer confidence, recently reached a high for this cycle, but it has room to go higher so it is too early to say that it has peaked.
Each of these three indicators usually leads a bull market top by 5-7 months and a recession by a year or more. Both Alan Greenspan and his successor as chairman of the Federal Reserve System Board of Governors, Ben Bernanke, have said the yield curve should not be interpreted “as indicating a significant economic slowdown,” let alone a recession. However, of the 18 flattened/inverted yield curves since 1900, all have pointed to a recession except ONE (in 1967). According to Forbes Magazine (1/23/89), the 1967 flattening preceded a “growth recession” but not an “official” recession, with industrial production falling from the first quarter to the third quarter. A bear market in the preceding year of 1966 lost 25% in anticipation of a recession. While the average lead time from flattening/inversion to recession is about a year, on four occasions this indicator led a recession by two years. So, while it is unlikely that a recession will start in 2006, it is not unlikely for one to occur in 2007 or perhaps 2008.
The stock market will, of course, begin to anticipate a recession some nine months ahead, on average. And when might that be? Of the last eleven bull market tops dating back to 1961, ten occurred when the Federal Funds Rate was above 5%. It would appear we have SOME time left. It is important to keep an eye on the Federal Reserve to see if they will stop at a nice round neutral number like 5%, or overshoot as they often do.
Step 3
Third, I keep my eye on our Major-trend Indicators, which are currently all positive:
DOW THEORY INDICATOR: Current Signal is Buy (GREEN). This indicator has signaled 100% investment since May 2, 2003 at the 8,582.68 level. The Dow Theory is “in the clear” with both the Dow Industrials and Transports, and the S&P 500 continuing to set new bull market highs in April.
SCHANNEP TIMING INDICATOR: Current Signal is Buy (GREEN). This indicator signaled a 50% investment on July 19, 2002 at 8,019.26 and a remaining 50% investment on November 21, 2004 at 10,489.42 for an average entry level of 9254.34. The components of this Indicator continue to be positive, even as the Federal Reserve raises short-term interest rates. A yield above 5% on the Federal Funds Rate would approach the danger zone. The danger threshold could be 6% as in 1978, 1981, 1987 and 1990, but 5% is more usual.
COMPOSITE TIMING INDICATOR: Current Signal is Buy (GREEN). This indicator signaled 75% investment between July 19, 2002 and May 2, 2003 at 8,465.73 and a remaining 25% investment on November 21, 2004 at 10,489.42 for an average entry level of 8971.17. Since neither of the two preceding indicators (which combine to form this indicator) looks to be changing, the outlook for this indicator is favorable.
The Bottom Line
EACH of January and February are great indicators of how a particular year will end for the stock market. When the market has risen in January (February), there has been an 85% (87%) chance that it would be higher yet at year end. When BOTH January and February have been up, the odds of an even higher year end are 96%!! That worked in 2004. Now again in 2006 both months closed higher. We’ll see whether the odds work this year — but why would they not?
I think it must be obvious from all that I have written above that I expect this bull market to continue. As noted in my January letter to subscribers, I expect the low for the year happened that month. Why do I even mention the next recession? Because we want to be ready for it when it comes. We cannot anticipate the next terrorist attack, but we can anticipate the next recession — there WILL be one, quite possibly in the next year or two!
An increase in unemployment due to layoffs in the home-building industry will likely contribute to the next recession. U.S. Department of Labor statistics show that the real estate construction (and extraction) industry has grown by more than one percentage point of the total national employment pool (from 5.4% to 6.6%) over the last couple of years. Adding in increases in the numbers of real estate agents, mortgage brokers and related occupations sets a new record for employment in the overall real estate industry. A return to pre-boom employment levels in that industry would by itself raise the national unemployment rate by over 1%. As you know from my “Special Report on Rising Unemployment,” an increase of only 0.4% in unemployment on a three-month moving average has signaled recession all ten times since 1948. I am not predicting that a rise will begin soon, and in fact think there will be a delay in the slowdown triggering layoffs that would cause a recession, but we should be looking out for it.
And so, we watch and wait and in the meantime stay fully invested.
Thanks to Jack Schannep for summarizing his forecasting methodology and current outlook.
See our “Dow Theory Long Dead?” for a carefully analytic reconsideration of Dow Theory as a momentum timing strategy by Stephen Brown, William Goetzmann and Alok Kumar.
Frequently Asked Questions
What is market timing in stock investing?
Market timing is the practice of deciding when to be invested in or out of the stock market based on where it stands in the bull/bear cycle and the economic cycle. In Jack Schannep's approach, an investor assesses bull market size and duration, economic expansion or recession signals, and major-trend indicators to judge whether it is too late to buy or too early to sell.
Does the length of a bull market predict how much longer it will last?
Historical bull market length offered Jack Schannep a guide to likely continuation, not a guarantee. Seven of the last eight bull markets that lasted 36 months went on to last at least 48 months, and over half of the last seven that reached a fourth anniversary ended between their 49th and 61st months. On that basis, he expected the bull market that began in 2002 to last into October 2006 and possibly to October 2007.
How do you tell whether a bull market is early or late in its cycle?
Schannep defines an official bull market as a 19% rise on both the Dow Jones Industrial Average and the S&P 500, then compares its gain and longevity to the distribution of past bull markets by quartile. The bull market he examined, up 56% on the Dow and 69% on the S&P 500 over 42 months, fell in the 2nd quartile for gains and the 3rd quartile for longevity. He also checks the economic cycle with indicators such as volume, yield curve flattening and consumer confidence, plus trend indicators including the Dow Theory signal.
Does a flattening yield curve always mean a recession is coming?
A flattening or inverted yield curve has preceded a recession in 17 of 18 instances since 1900, with 1967 the lone exception, which saw a growth recession rather than an official one. The average lead time to recession is about a year, though on four occasions it was two years. Fed chairmen Greenspan and Bernanke said the curve should not be read as signaling a significant slowdown, and Schannep considered a 2006 recession unlikely but a 2007 or 2008 recession plausible.
What are the risks of relying on historical patterns to time the stock market?
Historical patterns only indicate odds, not certainty, and each past bull market differs. Schannep notes that no bull market lasts forever, that this one was already "long in the tooth" at 42 months, and that the Federal Reserve often overshoots a neutral rate such as 5%, which could end the advance sooner. He also cites unpredictable events such as a terrorist attack, and his own call that the year's low occurred in January is only an expectation.