Do aggregate positions in put and call options on individual stocks, as indicators of sentiment of informed traders, predict future market returns? In their July 2017 paper entitled “Stock Return Predictability: Consider Your Open Options”, Farhang Farazmand and Andre de Souza examine the power of average value-weighted put option open interest divided by average value-weighted call option open interest in individual U.S. stocks (PC-OI) to predict U.S. stock market returns. Specifically, they:
- Compute for each stock each day total put option open interest and total call option open interest.
- Average daily values for each stock by month and weight by market capitalization.
- Calculate PC-OI by dividing the sum of monthly capitalization-weighted average put option open interest by the sum of monthly capitalization-weighted call option open interest.
- Each month, relate via regression monthly PC-OI to stock market return the next three months to determine the sign of the future return coefficient.
- Each month, create a net signal from the sum of the signs of these coefficients from the last three monthly regressions. A positive (negative) sum indicates a long (short) position in the stock market and an offsetting short (long) position in the risk-free asset.
They further test whether PC-OI predictive power concentrates in stocks with unique informativeness as represented by high idiosyncratic volatility (individual stock return volatility unexplained via regression versus market returns). For comparison, they also test their model with S&P 500 index options. Using daily open interest for options on AMEX, NYSE and NASDAQ common stocks and on the S&P 500 Index with moneyness 0.8-1.2 and maturities 30-90 days, associated stock characteristics, and contemporaneous U.S. stock market returns during January 1996 through August 2014, they find that:
- PC-OI for all stocks (high-idiosyncratic volatility stocks) over the sample period:
- Has average value 0.67 (0.69), compared to 1.51 for the S&P 500 Index.
- Has correlation 0.15 (0.15) with PC-OI for the S&P 500 Index.
- Peaks during recessions.
- Significantly predicts stock market returns at a 3-month horizon with R-squared statistic 0.06 (0.12). There is some predictability at a 1-month horizon, but not at 6-month, 9-month and 12-month horizons.
- Multivariate tests indicate that PC-OI predictive power is substantially independent of other widely used stock market return predictors.
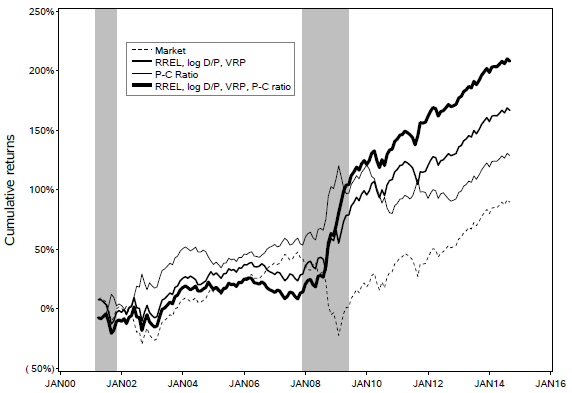
- Regarding the stock market timing approach outlined above, over the sample period (see the chart below):
- Cumulative capitalization-weighted stock market return is 89.6%.
- Using PC-OI based on high-idiosyncratic volatility stocks as specified, gross cumulative return is 129%.
- Using PC-OI based on high-idiosyncratic volatility stocks in combination with three other indicators based on short interest rate trend (RREL), market dividend yield (log D/P) and variance risk premium (VRP), gross cumulative return is 208%.
The following chart, taken from the paper, compares gross cumulative returns of three U.S. stock market timing strategies that are each month long (short) the market and short (long) the risk-free rate according to the sign of the following trading signals:
- RREL, log D/P, VRP – A combination indicator based on RREL (3-month U.S. Treasury bill yield minus its 12-month moving average), log D/P and VRP.
- P-C Ratio – The PC OI indicator as specified above based on high-idiosyncratic volatility stocks only.
- RREL, log D/P, VRP, P-C Ratio – A combination indicator based on RREL, log D/P, VRP and P-C Ratio.
It also includes the cumulative return for buying and holding the capitalization-weighted U.S. stock market (Market) as a benchmark.
All three sets of trading signals beat the market on a gross basis. However:
- Outperformance concentrates during the 2008-2009 financial crisis, which is very unusual and elevates concern about parameter snooping bias (luck over a short time).
- P-C Ratio clearly underperforms the market since the financial crisis.
Testing multiple models on the same data introduces another level of snooping bias, such that the best-performing model overstates expectations.
In summary, evidence indicates that the capitalization-weighted average of put-to-call ratios across individual stocks may have some power to predict future stock market returns.
Cautions regarding findings include:
- Trading strategy tests are gross, not net. Costs of iterative switching between long and short stock market positions would debit performance.
- The specified trading signal (especially when based on high-idiosyncratic volatility stocks) requires considerable data collection/processing beyond the capabilities of most investors, who would bear fees for delegating to an investment/fund manager.
- Timely availability of input data for the trading strategy may be problematic.
- The 3-month return horizon used in most tests is optimal, with attendant data snooping bias, such that findings overstate expectations. There may also be snooping bias in the choice of the last three months of regressions for signal generation.
- As noted, testing many models for predicting 3-month future returns introduces further snooping bias, such that the best-performing model overstates expectations.