Are short sellers on average well-informed, such that aggregate equity short interest usefully predicts stock market returns? In the January 2015 draft of their paper entitled “Short Interest and Aggregate Stock Returns”, David Rapach, Matthew Ringgenberg and Guofu Zhou investigate the relationship between aggregate equity short interest and future stock market performance. They aggregate short interest as the equally weighted average of short interests as percentage of shares outstanding across individual stocks. They next detrend the aggregate short interest series to remove an upward linear trend. They then standardize the series to have a standard deviation of one and designate the result as the Short Interest Index (SII). Finally, they relate SII to future S&P 500 Index excess (relative to the one-month U.S. Treasury bill yield) returns at horizons of one, three, six and 12 months. They also compare SII to 14 other widely used stock market return predictors. Using monthly (mid-month) short interest data for U.S. stocks (excluding very small firms and low-priced stocks, but including REITs and ETFs), data for 14 other widely used U.S. stock market return predictors and S&P 500 Index excess returns during January 1973 through December 2012, they find that:
- The equally weighted average short interest (as a percentage of respective shares outstanding) has an average (median) value of 2.03% (1.27%) over the sample period. The average increases from 0.31% in the first decade to 5.07% in the last, with a maximum of 8.93% in July 2008.
- SII exhibits considerable volatility, especially around business cycle turning points. It increases substantially in mid-2008 and subsequently falls sharply late during the financial crisis.
- Aggregate short interest is largely uncorrelated with the 14 other predictors, suggesting unique information.
- Aggregate short interest relates negatively to future stock market returns, both in-sample and out-of-sample.
- In-sample regressions show that a one standard deviation increase in SII relates to a 6% decrease in annualized future excess stock market returns. SII is at least as good as all 14 other predictors at a monthly horizon and easily beats them at quarterly, semi-annual and annual horizons.
- Regressions applied out-of-sample to predict stock market excess returns during 1990-2012 indicate that SII outperforms the historical average return and all other 14 predictors at horizons of three, six and 12 months, especially during 2007 through 2012.
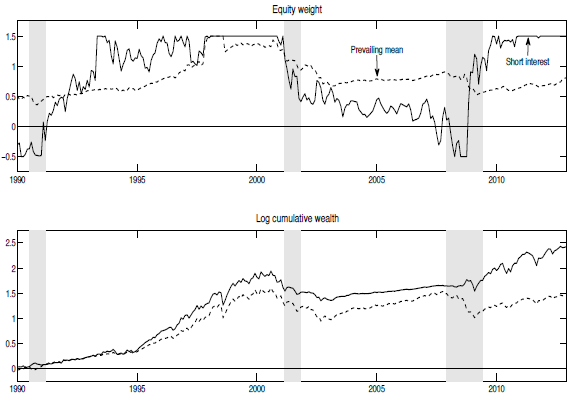
- A risk-averse investor who rebalances between the S&P 500 Index and U.S. Treasury bills based on SII regressions during 1990-2012 at the same frequency as the forecast horizon, allowing equity weights between -50% and +150% (see the charts below):
- Accrues annualized gross certainty equivalent gains of 3.5%, 3.8%, 4.6% and 2.8% for horizons of one, three, six and 12 months, respectively. Results far outperform those of the 14 other predictors. During the 2007-2012 subperiod, annualized gross certainty equivalent gain is 11.2% for a one-month forecast horizon.
- Realizes gross annualized Sharpe ratios in the range 0.45 to 0.61, higher than those of the historical average return and all 14 other predictors.
- The power of SII to predict future stock market returns derives almost entirely from anticipation of aggregate cash flow news.
The following charts, taken from the paper, compare out-of-sample allocations and performances of two risk-averse (relative risk aversion coefficient of three) strategies that each month allocate funds to the S&P 500 Index and one-month U.S. Treasury bills, with equity weight constrained between -50% and +150%. One strategy regresses future stock market excess returns on SII (Short interest), and the other regresses future returns on the historical average return (Prevailing mean). The initial regression covers 1973-1989. Gray vertical bands indicate NBER economic contractions.
The upper chart compares allocations to equities for the two strategies. The SII strategy generally exhibits more forceful variations in equity allocation.
The lower chart compares gross cumulative values of $1 initial investments in the two strategies. Over the entire sample period, the SII strategy outperforms, with outperformance concentrated during the late 1990s and 2008-2009. However, the SII strategy does not outperform during 1990-1995 and underperforms during 2000-2007.
In summary, evidence indicates that investors may be able to exploit information about future U.S. stock market returns from equally weighted aggregate equity short interest, but benefits appear to be uneven over time.
Cautions regarding findings include:
- Reported performance is gross, not net. Periodic portfolio rebalancing incurs trading frictions that would lower performance. Moreover, the cost of shorting when short and the cost of leverage when equity weight is over 100% would further lower performance. Specifically:
- In the chart above, since equity weight for the strategy based on aggregate short interest exhibits greater volatility and extremes, findings based on net performance may differ from those based on gross performance.
- It is not obvious that an allocation strategy based on aggregate short interest outperforms buying and holding an equity index fund on a net basis.
- As noted, the value of the information in aggregate short interest concentrates during the late 1990s and 2008-2009, suggesting usefulness only under some conditions.
- Data collection and processing required to exploit short interest aggregated as specified may be beyond the reach of many investors. Delegation to a manager would incur fees.
- Testing of many predictors on the same dataset introduces data snooping bias, such that performance of the winning predictor incorporates good luck unlikely to persist.
See “Aggregate Short Interest as a Stock Market Indicator” for a simpler approach based on monthly NYSE aggregate short interest.