A reader requested review of the Decision Moose asset allocation framework. Decision Moose is “an automated stock, bond, and gold momentum model developed in 1989. Index Moose uses technical analysis and exchange traded index funds (ETFs) to track global investment flows in the Americas, Europe and Asia, and to generate a market timing signal.” The trading system allocates 100% of funds to the index projected to perform best. The site includes a history of switch recommendations since the end of August 1996, with gross performance. To evaluate Decision Moose, we assume that switches and associated trading returns are as described (out of sample, not backtested) and compare the returns to those for dividend-adjusted SPDR S&P 500 (SPY) over the same intervals. Using Decision Moose signals/performance data and contemporaneous SPY prices during 8/30/96 through 9/30/19 (23+ years), we find that:
In calculating SPY total returns by Decision Moose switching interval, we assume fund switches occur at the close on Decision Moose signal dates, or at the close on the next trading day if signal dates are not trading days.
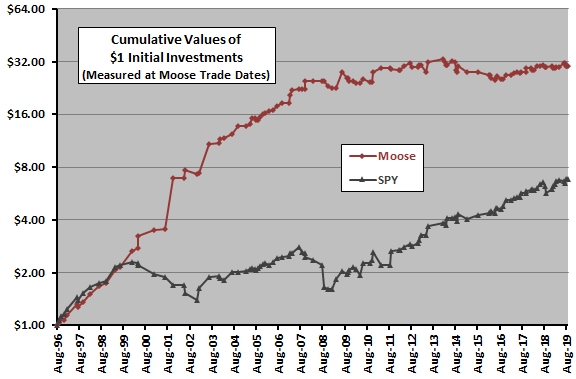
The following chart compares on a logarithmic scale the trade-by-trade gross cumulative values of $1 initial investments in Decision Moose and SPY over the full sample period. Notable points are:
- Over the full sample period, the gross compound annual growth rate (CAGR) for Decision Moose is 15.9%, compared to 8.7% for SPY. Decision Moose performance weakens after the 2008-2009 financial crisis.
- Measured on switch dates, maximum drawdown (MaxDD) for Decision Moose is -24.5% (3/7/14 through 6/24/16). For SPY, MaxDD is -42.9% (10/5/07 through 4/10/09). MaxDDs are likely deeper between signal dates.
- Decision Moose outperformance concentrates during U.S. equity bear markets.
- Decision Moose has two very large positive trades in 2001-2002 (gold, +94.8%) and late 2003 (Asian stocks, +46.6%).
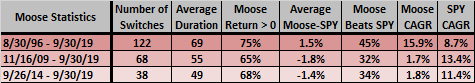
For additional perspective, we look at Decision Moose statistics for the full sample period and two recent subperiods.
The following table summarizes gross Decision Moose statistics over the full sample period and approximately 10 and five years ending 9/30/19. Over these periods, Decision Moose signals an average of 5.3-7.5 fund switches per year. Decision Moose underperforms SPY markedly over the last 10 and five years.
Including trading frictions would shave Decision Moose performance by a small percentage depending on broker fees, fund bid-ask spread and trader account size. For small accounts, this friction may be material.
For a more detailed trend analysis, we look at signal-to-signal outperformance relative to SPY.
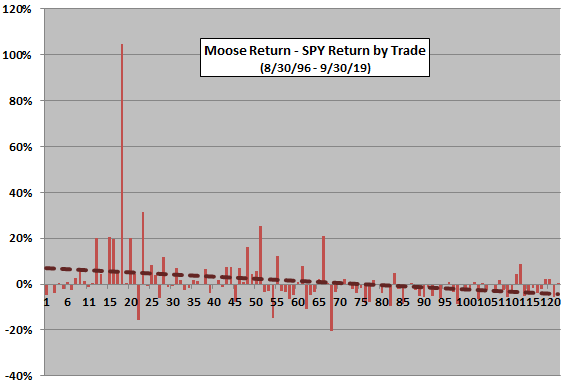
The next chart summarizes differences between Decision Moose gross signal-to-signal returns and contemporaneous SPY returns over the full sample period, with a dashed best-fit linear trend line. The trend line indicates that Decision Moose initial outperformance deteriorates to underperformance.
Is the signal 18 outlier (gold during 11/24/01 through 6/1/02) decisive in determining the trend?
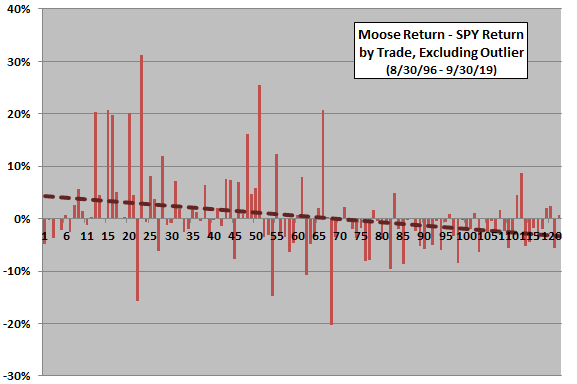
The next chart summarizes the differences between Decision Moose gross signal-to-signal returns and contemporaneous SPY returns over the full sample period, excluding the signal 18 outlier. The best-fit linear trend line still still deteriorates to underperformance.
Trend by trade could mislead, because Decision Moose holding periods vary. What happens to the trend if we normalize results based on performance relative to SPY per calendar day?
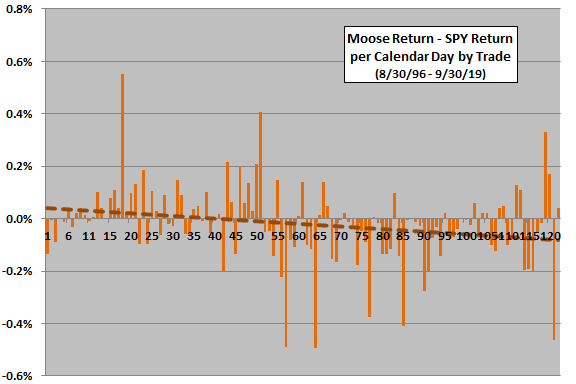
The next chart summarizes differences between Decision Moose signal-to-signal gross returns and contemporaneous SPY returns per calendar day over the full sample period. The best-fit linear trend line indicates marked deterioration of Decision Moose normalized outperformance over time.
Possible interpretations of trend tests are: (1) Decision Moose is lucky in the first half of the sample period; (2) Decision Moose is unlucky in the second half of the sample period; and/or, (3) financial markets substantially adapt to Decision Moose-like tactical allocation strategies (anticipating/crowding positions). However, sample size is not large in terms of number of U.S. equity bull and bear markets, and a long bull market for SPY begins at about signal 56.
What does a regression show about the relationship between Decision Moose gross returns and SPY returns?
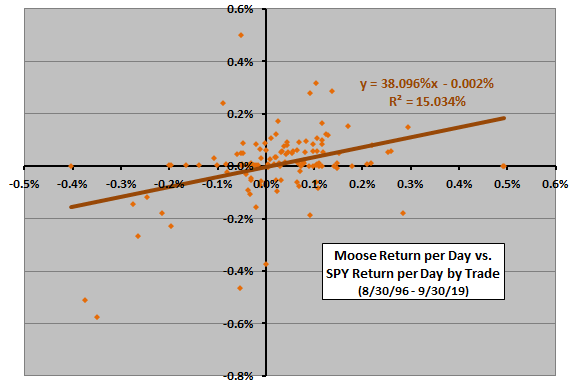
The following scatter plot presents a regression-based perspective on normalized gross Decision Moose performance over the entire sample period. Results indicate that:
- Decision Moose generates gross daily alpha of about -0.002% relative to buying and holding SPY. (Over the past five years, this alpha declines to -0.031%.)
- Decision Moose has beta 0.38 relative to buying and holding SPY.
- Based on the R-squared statistic, SPY returns explain only about 15% of Decision Moose returns.
The latter two points indicate that Decision Moose performance is a potential diversifier of the U.S. stock market.
Note that regressions assume a linear relationship. The relationship may be non-linear.
In summary, Decision Moose may offer investors a way to beat and diversify the broad U.S. stock market over the very long term by trading to the “hottest hand” (in economic context) from a set of nine asset class proxies, but it markedly underperforms SPY since the financial crisis.
Cautions regarding findings include:
- As noted, the sample of trades is not large for trend analysis, especially in terms of number of U.S. equity bull and bear markets.
- As noted, Decision Moose may be materially worse than shown for small accounts and immediately taxable accounts.
- From a theoretical perspective, SPY is not the most appropriate benchmark for Decision Moose, which employs nine distinct asset classes.