A reader suggested looking at the strategy described in “Kaeppel’s Corner: Sector Seasonality” (from November 2005, link no longer in place) and updated in “Kaeppel’s Corner: Get Me Back, Clarence” (from October 2007, link no longer in place). The steps of this calendar-based sector strategy are:
- Buy Fidelity Select Technology (FSPTX) at the October close.
- Switch from FSPTX to Fidelity Select Energy (FSENX) at the January close.
- Switch from FSENX to cash at the May close.
- Switch from cash to Fidelity Select Gold (FSAGX) at the August close.
- Switch from FSAGX to cash at the September close.
- Repeat by switching from cash to FSPTX at the October close.
Does this strategy materially and persistently outperform? To investigate, we compare results for three alternative strategies: (1) Kaeppel’s Sector Seasonality strategy (Sector Seasonality); (2) buy and hold Vanguard 500 Index Investor (VFINX) as an investable broad index benchmark (VFINX); and, (3) a simplified seasonal strategy using only VFINX from the October close through the May close and cash otherwise (VFINX/Cash). Using monthly dividend-adjusted closing levels for FSPTX, FSENX, FSAGX, the 3-month Treasury bill (T-bill) yield as the return on cash and VFINX over the period December 1985 through May 2017 (about 31.5 years), we find that:
Calculations assume that:
- The return on cash for a month is one twelfth the prior month T-bill yield.
- Given the nature of the trades, there are no trading frictions.
- There are no tax implications of trading.
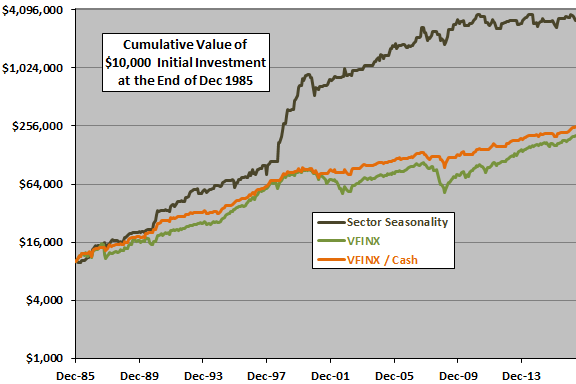
The following chart compares on a logarithmic scale the cumulative values of $10,000 initial investments at the end of December 1985 for all three strategies over the entire sample period. The Sector Seasonality strategy clearly outperforms with compound annual growth rate (CAGR) 20.1%, compared to 9.4% for VFINX and 10.2% for VFINX/Cash. The burst for Sector Seasonality in 1998-1999 includes a 55% jump in the gold fund during September 1998.
Maximum drawdowns for Sector Seasonality, VFINX and VFINX/Cash are -39%, -51% and -29%, respectively.
For another perspective, we look at monthly return statistics.
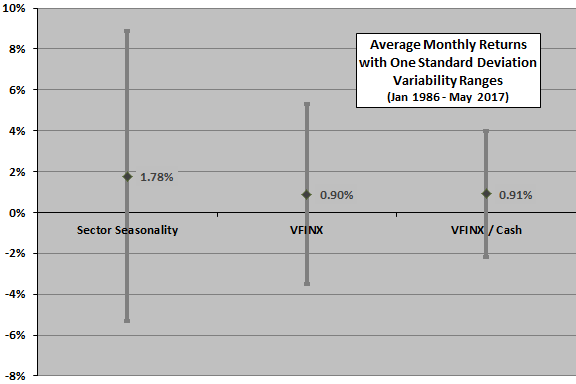
The next chart compares average monthly returns and standard deviations of monthly returns for the three strategies over the entire sample period. The Sector Seasonality strategy generates a substantially higher average monthly return than the benchmark alternatives, but with a considerably higher variability in monthly returns. However, the cumulative profile above suggest that monthly upsides, rather than downsides, drive the high standard deviation.
The Sector Seasonality strategy beats VFINX in 205 of 377 months (54%).
How do the monthly parts contribute to the whole for the Sector Seasonality strategy?
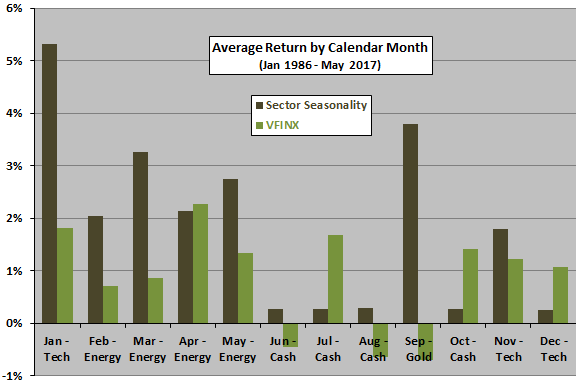
The next chart shows the average return by calendar month for the Sector Seasonality strategy and for VFINX over the entire sample period. Sector Seasonality beats VFINX on average in eight of 12 months, with outperformance most pronounced for January and September. 1996-2001 drive outperformance of the technology sector fund in January. 1998, 1999, 2005, 2007 and 2012 drive outperformance of the gold sector fund in September.
Is the average outperformance of the Sector Seasonality strategy consistent over the sample period?
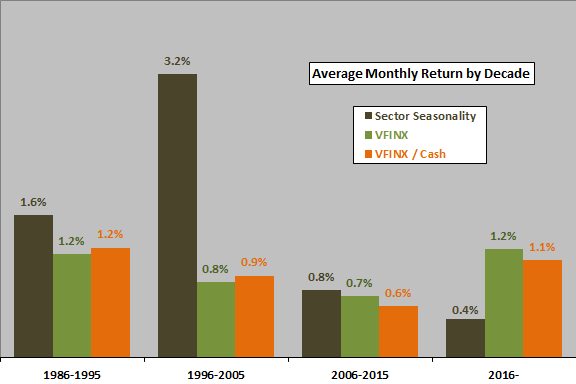
The next chart summarizes average monthly returns for the three strategies by decade. The Sector Seasonality strategy outperforms the other two strategies easily during the first two decades, but only slightly in the third. The third and fourth decades (with Sector Seasonality underperforming so far during the latter) are entirely post-publication.
For wider perspective, we look at annual returns.
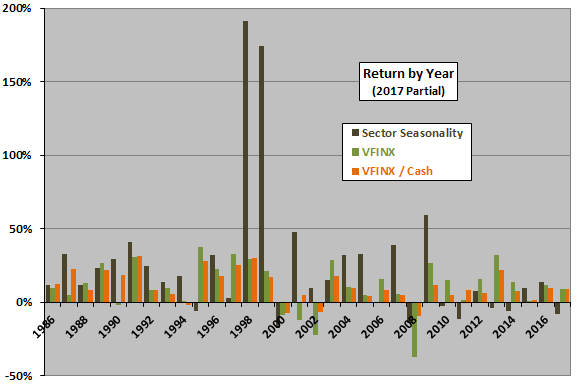
The next chart compares annual returns for the three strategies by calendar year over the sample period (2017 partial). It shows that 1998 and 1999 drive the elevated outperformance of the middle subperiod above (due to extremely strong performances during those two years by the technology sector and gold sector funds). The Sector Seasonality strategy beats buying and holding VFINX in 19 of 32 years (59%) and VFINX/Cash in 20 of 32 years (62%).
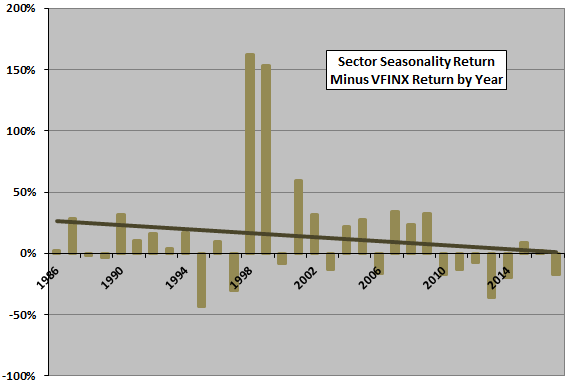
Is the outperformance of the Sector Seasonality strategy weakening?
The final chart plots annual performance of the Sector Seasonality strategy in excess of VFINX over the sample period, with a best-fit linear trend line. The trend line slopes downward from left to right, indicating that Sector Seasonality weakens over time. Specifically:
- Over the last 10 years, CAGR for Sector Seasonality is 4.1%, compared to 6.8% for VFINX and 6.6% for VFINX/Cash.
- Over the last 5 years, CAGR for Sector Seasonality is 3.8%, compared to 15.2% for VFINX and 7.5% for VFINX/Cash.
- Over the last 3 years, CAGR for Sector Seasonality is -4.6%, compared to 10.0% for VFINX and 11.1% for VFINX/Cash.
Results suggest data snooping in Sector Seasonality strategy development (and perhaps unlucky recent performance).
The sample period is not long for this kind of test.
In summary, evidence from simple tests indicates that Kaeppel’s Sector Seasonality strategy easily beats buying and holding the U.S. stock market over the past 3+ decades, but has weakened and is unattractive in recent years.
With disappearance of links to the original articles, this is the last update of this long verification test. Findings emphasize the risk of adopting a strategy for which historical outperformance derives from data snooping bias (luck) in the backtest. Fitting to luck is especially easy when there are just a few extreme returns.
Cautions regarding findings include:
- As noted, the sample period is not long for analysis of seasonality, especially for subperiods.
- Distributions of returns may be materially non-normal (especially gold), such that “normal” statistics are not representative of future behaviors.
- Market adaptation is an alternative to data snooping as an explanation of post-publication performance.