Does the conventional wisdom to “Sell in May” (and “Buy in November”, hence also the term “Halloween Effect”) work over the long run, perhaps due to biological/psychological effects of seasons (Seasonal Affective Disorder)? To check, we turn to the long run dataset of Robert Shiller. This data set includes monthly levels of the S&P Composite Index, calculated as average of daily closes during the month. We split the investing year into two half-years (seasons): May through October, and November through April. Using S&P Composite Index levels, associated dividend yields and contemporaneous long-term interest rates (comparable to yields on 10-year U.S. Treasury notes) from the Shiller dataset spanning April 1871 through April 2021, we find that:
Modeling assumptions for this backtest are complex, as follows:
- Funds switch between stocks and cash at the ends of April and October. Since the monthly level is the average daily close for the month, this assumption may be a little optimistic or pessimistic.
- Since December 1958 cash earns half the annualized yield on 6-month U.S. Treasury bills. Before that date, we estimate 6-month return on cash as half the long-term interest rate in the Shiller dataset less 1.35%, which is the average monthly difference between 10-year U.S. Treasury note yield and 6-month U.S. Treasury bill yield since December 1958 (the first month both series are available). This estimate of the term spread may not be representative of pre-1950s data.
- Dividends accrue while in stocks, with one half of the annual yield paid during each 6-month interval and frictionless reinvestment. This dividend smoothing assumption could bias results, and frictionless reinvestment of dividends is optimistic.
- Baseline trading frictions for moving in and out of the S&P 500 Composite Index are a constant 1% over the sample period. This assumption is crude, as indicated in “Trading Frictions Over the Long Run”. Given the challenges of constructing a portfolio from index components during much of the sample period, this baseline value may be optimistic. For recent data, it is pessimistic. However, trading is infrequent.
- Ignore the tax implications of trading.
The limitations of these assumptions, as well as those of the interpolation methods used in constructing the early part of the source dataset, make this analysis more of a conceptual test than a strategy backtest.
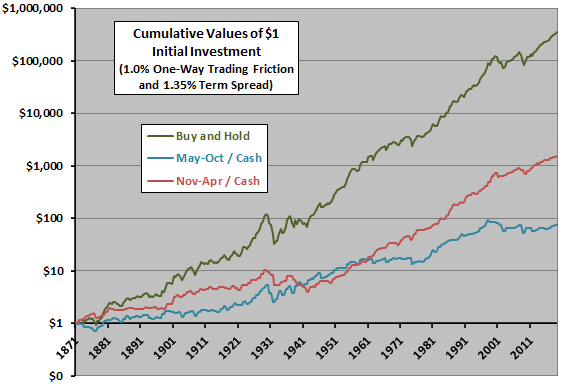
The following chart compares on a logarithmic scale cumulative values of $1.00 initial investments for three strategies using baseline assumptions over the entire sample period:
- Buy and Hold – buy and hold stocks.
- May-Oct / Cash – in stocks (cash) during May-October (November-April).
- Nov-Apr / Cash – in stocks (cash) during November-April (May-October).
In support of conventional wisdom, being in stocks during November-April mostly beats being in stocks during May-October (terminal value $1,697 versus $92). However, buying and holding the index substantially outperforms both seasonal strategies.
For another perspective, we compare average 6-month return statistics for the strategies.
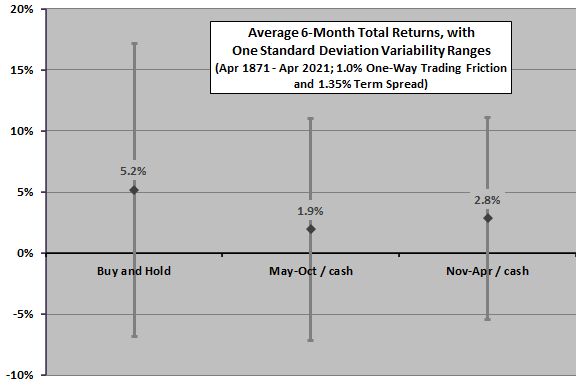
The next chart compares the average 6-month total returns for the three strategies using baseline assumptions over the entire sample period, with one standard deviation variability ranges. Average total return for being in stocks during November-April is higher and volatility of returns is lower than for being in stocks during May-October, supporting conventional wisdom. Buying and holding stocks generates a substantially higher average total return, but with much higher volatility.
Rough 6-month net Sharpe ratios are 0.30, 0.04 and 0.15 for buy-and-hold, May-October and November-April, respectively.
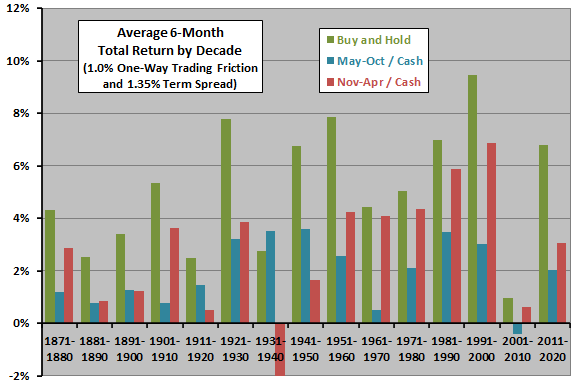
For a different perspective on time variation of returns, we look at average seasonal total returns by decade.
The next chart compares average 6-month total returns by decade using baseline assumptions (the last decade partial only). Based on this metric, being in stocks during November-April beats being in stocks during May-October for 11 of 15 decades, consistently after 1950. However, poor returns for being in stocks during November-April for the 1930s and 1940s weaken the argument for a reliable biological/psychological explanation of seasonal returns.
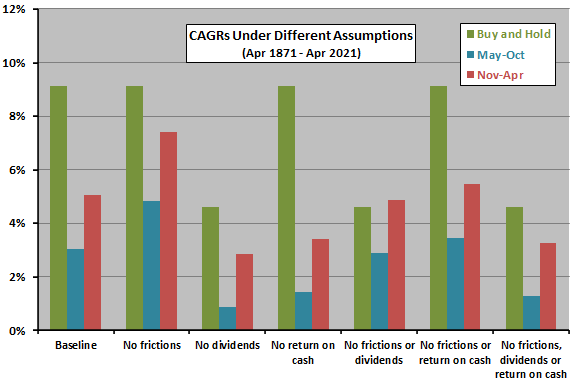
How sensitive are results to modeling assumptions?
The next chart compares compound annual growth rates (CAGR) for the three strategies over the sample period using different sets of assumptions. Results consistently confirm the superiority of being in stocks during November-April as compared to being in stocks during May-October. However, only by ignoring both trading frictions and dividends does being in stocks only during November-April become competitive with buying and holding stocks.
Is “Sell in May” sensitive to market state (bull or bear)?
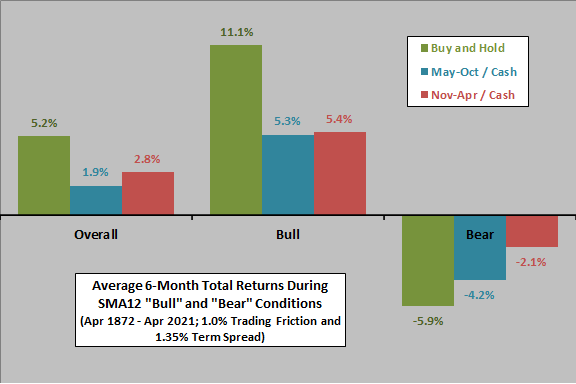
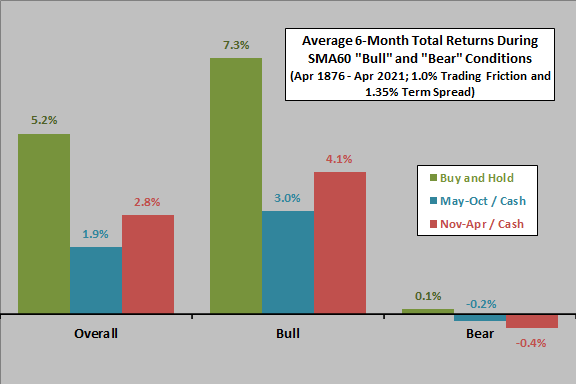
The final two charts summarize average 6-month total returns for two ways of prospectively defining bull and bear states for the U.S. stock market:
- For the upper chart, the market is in a cyclical bull state when prior-month S&P 500 Composite Index is above (below) its 12-month simple moving average (SMA12) and in a cyclical bear state when the index is below its SMA12.
- For the lower chart, the market is in a secular bull state when the prior-month S&P 500 Composite Index is above its 60-month simple moving average (SMA60) and in a secular bear state when the index is below its SMA60.
Results for SMA12 indicate that most of the advantage of November-April over May-October occurs during bear markets. For SMA60, most of the advantage occurs during bull markets.
In summary, evidence from rough modeling over the long run suggests that U.S. stocks generally do better during November-April than during May-October, but (with reasonable assumptions about return on cash, dividends and trading frictions) buying and holding stocks easily outperforms a “Sell in May” market timing strategy.
Cautions regarding findings include:
- As noted, the data set establishes monthly S&P Composite Index levels by averaging daily closes during the month, somewhat blurring seasonal effects.
- As noted, modeling of trading frictions and pre-1959 return on cash is crude.
- Ignoring taxes materially benefits an intra-year timing strategy relative to buy-and-hold.
- Use of an index, rather than a tradable asset, tends to overstate returns by ignoring the costs of establishing and maintaining a liquid asset.
- Older data may be less reliable than recent data.