Does the New Year’s Day holiday, a time of replanning and income tax positioning, systematically affect investors in a way that translates into U.S. stock market returns? To investigate, we analyze the historical behavior of the S&P 500 Index during the five trading days before and the five trading days after the holiday. Using daily closing levels of the S&P 500 Index around New Year’s Day for 1951-2024 (74 observations), we find that:
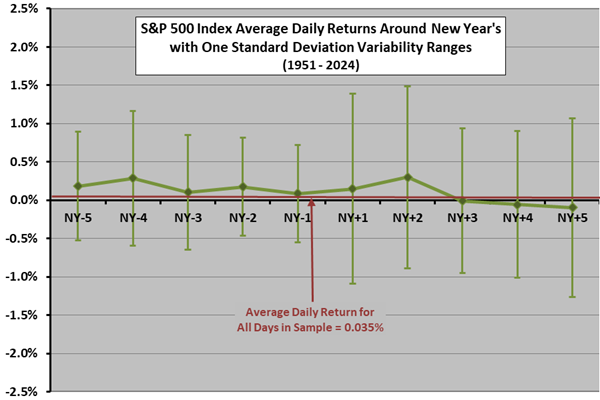
The following chart shows average daily S&P 500 Index returns from five trading days before (NY-5 to NY-1) through five trading days after (NY+1 to NY+5) New Year’s Day over the full sample period, with one standard deviation variability ranges. The average daily return for all trading days in the sample is 0.035%. Results on average suggest abnormal strength during the week before through two days after New Year’s Day, followed by a fade. As usual for daily data, noise generally dominates signal.
To check the reliability of findings, we look at two subsamples.
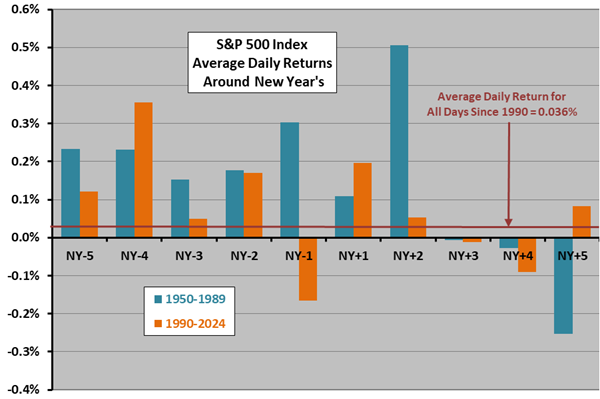
The next chart compares the average daily returns for the five trading days before and after New Year’s Day for two subsamples: 1951-1989 (39 events), and 1990-2024 (35 events). This chart has no variability ranges and uses a finer vertical scale than the preceding one. Subsamples partly confirm findings above, but subsample behaviors do differ.
In summary, best guess is that any anomalous U.S. stock market strength around New Year’s Day will start the week before and end two trading days after the holiday, followed by a fade, but noise generally dominates.
Cautions regarding the finding include:
- As noted, any return anomaly is small compared to return variability, so experience by year varies widely.
- To the extent that the distribution of daily S&P 500 Index returns is wild, interpretation of the average return and standard deviation of returns breaks down.