Investor mood may affect financial markets. Sports may affect investor mood. The biggest mood-mover among sporting events in the U.S. is likely the National Football League’s Super Bowl. Is the week before the Super Bowl especially distracting and anxiety-producing? Is the week after the Super Bowl focusing and anxiety-relieving? Presumably, post-game elation and depression cancel between respective fan bases. Using past Super Bowl dates since inception and daily/weekly S&P 500 Index levels for 1967 through 2022 (56 events), we find that:
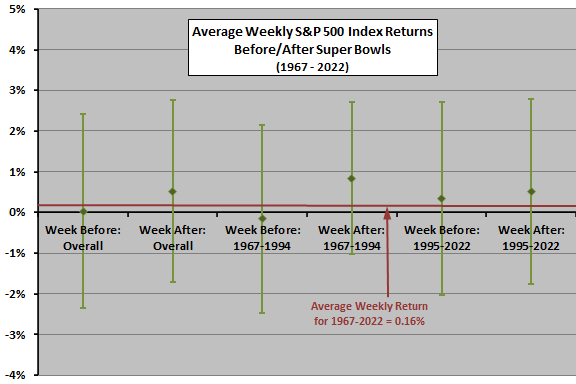
The following chart compares average behaviors of the S&P 500 Index the week before and the week after the Super Bowl over the full sample period and over two equal subperiods, with one standard deviation variability ranges. Notable points are:
- After is better than before. For the full sample period, average return during the week before (after) the Super Bowl is 0.03% (+0.52%), with standard deviation 2.38% (2.25%).
- This effect is stronger in the first half of the sample than the second half .
- This effect also holds for both the 29 American Football Conference wins and the 27 National Football Conference wins (not shown).
Sample and especially subsample sizes are modest, so a few more observations could materially alter findings.
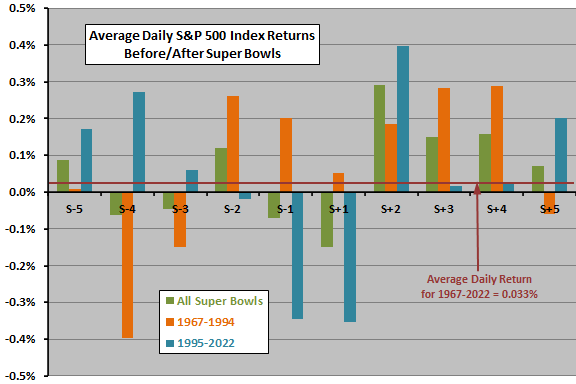
What about day-by-day returns?
The next chart plots average daily S&P 500 Index returns from five trading days before “Super Sunday” (S-5) through five trading days after (S+5), excluding two Mondays before the Super Bowl that are market holidays. The most consistent indication is mid-week strength after the Super Bowl. Subsample size is only 28, with return variability large compared to average return, so confidence in predictability is low.
In summary, evidence from simple tests on a modest sample supports some belief that the U.S. stock market is abnormally weak (strong) during the week before (after) the Super Bowl.
Cautions regarding the finding include:
- As noted, any average return indication is small compared to return variability, so experience by year varies widely.
- As noted, subsample sizes are small for reliable inference.