Trading Calendar – December
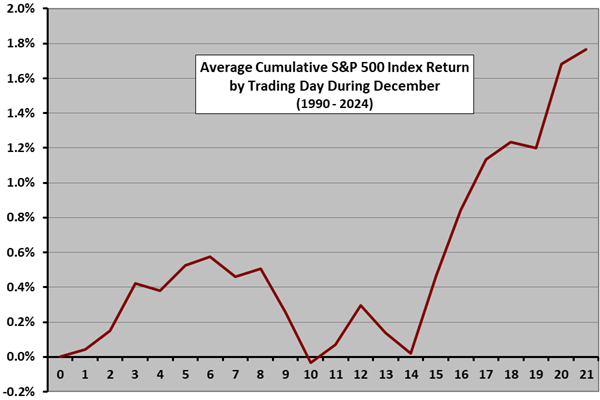
The following chart shows the average month-to-date percentage change in the S&P 500 index by trading day during December from 1990 through 2025. Day 0 represents the November close. The index during December tends to be positive, with the gains coming during the second half of the month (Santa Claus rally). We have not used data for trading day 22, because most Decembers do not have 22 trading days. Also, sample size is only 25-35 for specific trading days, so these results are only weakly suggestive rather than predictive. For 1990-2025, 26 Decembers have been winners and only 10 losers.
Return to the Trading Calendar to find other monthly profiles.