Do firms that manage accruals conservatively (liberally) tend to be good (bad) investments? In their June 2007 paper entitled “Repairing the Accruals Anomaly”, Nader Hafzalla, Russell Lundholm and Matt Van Winkle test adjustments to prior studies of the accrual anomaly to determine whether accruals can reliably predict future stock returns without look-ahead bias. One improvement is the use of Joseph Piotroski’s financial health score to refine accrual signals. The other improvement is to define accruals as a fraction of earnings rather than as a fraction of total assets. Using a sample of 72,668 firm-years spanning 1988-2004, they find that:
- Incorporating Piotroski’s financial health score substantially improves the effectiveness of a trading strategy based on traditionally defined accruals:
- A hedge strategy that is long (short) firms of high (low) financial health (ignoring accruals) generates an average size-adjusted annual return of 9.36% across the entire sample.
- After excluding firms with the lowest financial health scores, a hedge strategy that is long (short) the 10% of firms with the lowest (highest) traditional accruals generates an average size-adjusted annual return of 13.64%, with 7.98% coming from the long side.
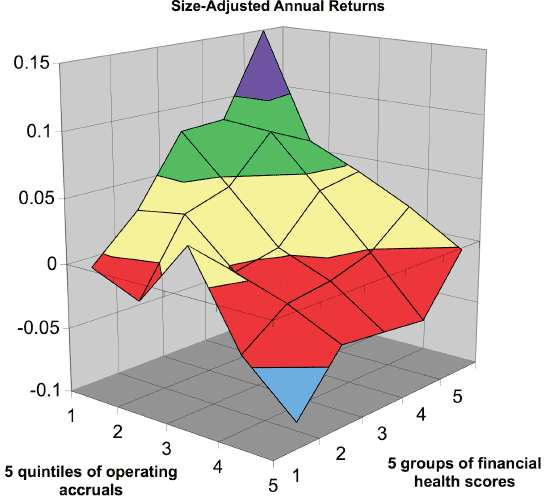
- Using the total sample, a hedge strategy that is long (short) low-accrual, high financial health (high-accrual, low financial health) firms produces an average size-adjusted annual return of 22.93%, with a 14.92% from the long side. (See the first chart below.)
- A hedge strategy based only on the new definition of accruals that is long (short) the 10% of firms with low (high) accruals generates an average annual return of 12.4%, with 5.4% coming from the long side. (See the second chart below.) This sort is radically different from that produced by the traditional definition of accruals, more readily isolating the accounting conditions for which the differences between sophisticated and naïve earnings forecasts are most extreme.
- These returns do not include transaction costs.
The following chart, taken from the paper, depicts the size-adjusted average annual returns for 25 portfolios sorted by traditionally defined operating accruals (as a percentage of assets) and by Piotroski’s financial health score. It shows that the accruals sort is much more meaningful when financial health is high than when it is low. Also, the peak in the back corner of the graph (low accruals and high financial health) is pronounced. Results suggest a hedge strategy that is long (short) the firm with low (high) operating accruals and good (bad) financial health, as quantified above.

The next chart, also from the paper, shows the return by year for a hedge strategy based only on accruals that is long (short) the 10% of stocks with the lowest (highest) accruals, with accruals defined as a fraction of operating earnings rather than as a fraction of total assets. It shows that the strategy consistently generates positive returns (not including transaction costs).

In summary, firm accruals may be a good indicator of future stock returns when combined with a broader measure of firm financial health, or when defined as a fraction of earnings rather than assets.