Because of the uncertainties involved in choosing stocks, investors/traders are constantly seeking affirmation of their picks. One place they go for affirmation is Jim Cramer’s Mad Money on CNBC. When you get Jim Cramer’s blessing, you’ve got an edge. Your returns will be better than those of your too-good-for-Cramer peers. Or will they? We construct a sample of Mr. Cramer’s “buys” and “sells” using:
The July 1, 2005 ‘Mad Money’ Recap: Lightning Round Review from TheStreet.com because that article summarizes “an all-lightning round hour in which he recapped some of the [65] buy and [43] sell ideas he provided to callers during the show in recent weeks.”
TheStreet.com’s “Lightning Round” summaries for the week of 8/1/05-8/5/05. These five summaries name 87 “buy” and 65 “sell” reactions that Mr. Cramer provided to callers during Mad Money that week.
We measure the performance of each of the 260 (152 “buy” and 108 “sell”) recommendations over the 1, 5, 10, 21, 63 and 126 trading days after Mr. Cramer makes the recommendation and then examine the aggregate performance of all recommendations by constructing an equal-weighted portfolios of “buys” and “sells.” We find that:
Cramer’s “Buys” Versus Broad Indices
The “buy” recommendations are: ADBE, ADP, ADSK, AIG, ALL, APA, ATK, AWGI, BA, BBY, BMY, BOW, BRCM, BYD, CBG, CHE, CHTT, CMGI (twice), CMX, COH, COP, CPN (twice), CSCO, DE (twice), DF, DIS (twice), DKS, DNA, DOV, DPL, DUK, EASI, EBAY, EC, ED, EENC, EOP, EP, EXP (twice), FLIR, FO, FON, FTBK, GD, GDP, GKIS, GLW (twice), GME, GRMN, GSF, GW, HRS, HSY, INFY, INTC (twice), IRC, ITT, ITWO, JCP, JPM, KBH, KMT, KSE, KWK, LEN, LMT, LTM, LU, MAR, MET, MFE, MO, MORN, MOT, MRVL (twice), MXT, NKE, NOC, NOV, NSM, NTES, NVTL, OIS, OKE, OLG, OLN, ORH, OVEN, PBR, PCG, PD, PDC, PEG, PNM, PNR, PNRA, PNY, PPG, PRU, PTR, PZZA, RAIL, RBK, RIG, RMK, ROST, SGR, SHLD (thrice), SIRI, SJT, SLB, SLG, SNDK, SRR (twice), STJ, SWB, SWKS (twice), TBL, TDW, TOL, TSO, TWX, TXI, TXN (twice), TXU, UPS, USPI, UTX, WLP, WMB, WTR, WWW, WWY, WYE, XTO (twice), YHOO (twice) and ZNT.
When Mr. Cramer mentions a stock more than once on different dates, we include returns for that stock multiple times using different start dates. In general, we use daily closing prices Yahoo! Finance for historical data. However, for a few companies that have declared bankruptcy, been acquired, merged or been delisted over the past seven months, we use historical charts from Marketocracy to estimate returns.
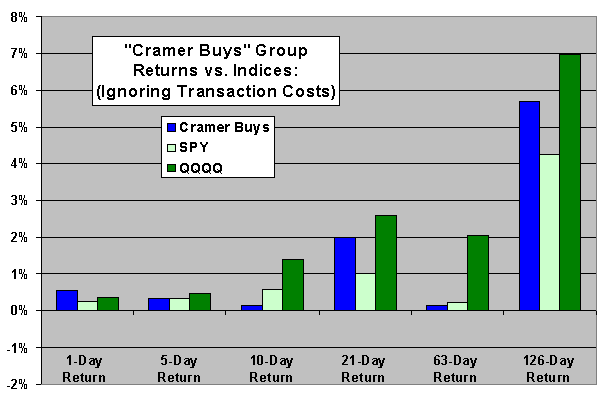
The following chart shows the average performance of “Cramer Buys” (equally weighted) over the 1, 5, 10, 21, 63 and 126 trading days after Mr. Cramer judges them. It also shows, as benchmarks, the average performance of S&P 500 Depository Receipts (SPY) and the NASDAQ 100 Trust Series 1 (QQQQ) over the same periods (averages weighted according to the number of “buys” Mr. Cramer identifies each day). It shows that Mr. Cramer’s recommendations, in aggregate, tend to match or outperform SPY but underperform QQQQ. Adding transaction costs for so many stocks, as compared with buying one index fund, would significantly reduce the returns for the “Cramer Buys fund” relative to those of the indices for small investors/traders. In such a real-life exercise, “Cramer Buys” might also underperform SPY. At the 126-day point, the standard deviation of returns across the “Cramer Buys” is 23.8%. With the range of returns across stocks so large, attempting to capture the aggregate return without purchasing all 152 “buys” would be very risky.

Cramer’s “Buys” Versus Cramer’s “Sells”
The “sell” recommendations are: ABRX, ACS, ADBL, ADLR, ADM, AFFX, AGR, AMD, AMTD, ANSS, ASPT, AUO, BAC, BIIB, BLDP, BOOM, BSX, C, CCE, CKFR, CL, COGN, CP, CRDN, CWTR, DELL, DRYS, DTV, DWA (twice), DY, ELN, ELNK, ELX, ELY, EPD, ERS, FBR, FCEL, FDRY, FDX, FFIV, FRO, GERN, GNTX, HLTH, HNZ, ISE, JCI, JPM, KANAE, KKD, KLIC, L, LUK, LYG, MAT, MATK, MCRI, MECA, MLI, MRGE, MXO, MXT, NAT, NFLX, NOK, NSTK, NTAP, NTMD, NTRI, NVTL, ORB, ORCL, OSUR, OVTI, PEET, PETS, PGIC, PKG, PRST (twice), PSUN, PWAV, PWR, RBAK, REGN, REV, SBL, SKX, SM, SNPS, SPRT, T, THC, THO, TMR, TPX, TSCO, TUP, UMC, VIP, VPHM, VZ, WIND (twice), ZBRA and ZEUS.
One stock that is a “buy” on 7/1/05 becomes a “sell” on 8/5/05 and is counted in both places. Again, when Mr. Cramer mentions a stock more than once on different dates, we include returns for that stock multiple times using different start dates.
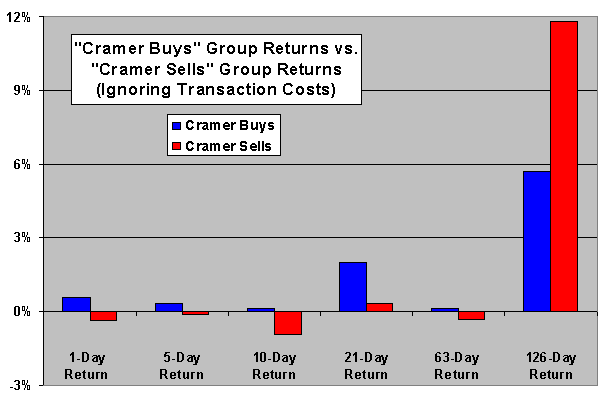
The following chart shows the average performance of the “Cramer Buys” and the “Cramer Sells” (both groups equally weighted) over the 1, 5, 10, 21, 63 and 126 trading days after Mr. Cramer judges them. The “Cramer Buys” outperform the “Cramer Sells” on average by up to 2% for all intervals except the longest term. After six months, the “Cramer Sells” substantially outperform the “Cramer Buys” (and QQQQ). This outperformance is not due to just a few stocks. The median performance of the “Cramer Sells” at six months is 5.7%, while the median for the “Cramer Buys” is only 4.0%. His worst “sell” judgments are: ADLR, AMD, CRDN, ELN, NTRI, OVTI, RBAK, REGN and ZEUS. At the 126-day point, the standard deviation of returns across the “Cramer Sells” is 35.6%, larger than the 23.8% for the “Cramer Buys.” The range of returns across stocks for the “Cramer Sells” is extremely large, so attempting to capture the aggregate return without buying all 108 “sells” would be extremely risky.

Note that:
- Samples of 152 and 108 provide moderate levels confidence, but our conclusions are not statistically bulletproof.
- As noted above, transaction costs are not reflected in the above charts. Such costs would significantly degrade returns for both the “Cramer Buys” and “Cramer Sells” portfolios for small investors.
- The above stock recommendations are Mr. Cramer’s assessments of audience-proposed stocks, and not necessarily his a priori selections.
- The mere mention of a stock on Mad Money may affect its performance by drawing investor attention, especially for small-capitalization firms. Presumably, “Cramer Buys” have an immediate positive return bias, and “Cramer Sells” have an immediate negative return bias.
In summary, Jim Cramer offers his viewers no protection regarding their investing/trading choices. His assessments of viewer-proposed stocks likely encourage market underperformance. In fact, his “sell” recommendations in aggregate may outperform the market after six months.
Mr. Cramer’s viewers should probably buy and hold broad index funds rather than trade stocks on his “Lightning Round” advice.
See Jim Cramer’s comments on this analysis.
For assessments of the commentaries of other market pundits and gurus, see Guru Grades.