How sensitive is the performance of the “Simple Sector ETF Momentum Strategy” to selecting ranks other than winners and to choosing a momentum ranking interval other than six months? This strategy each month ranks the following nine sector exchange-traded funds (ETF) on past return and rotates to the strongest sector:
Materials Select Sector SPDR (XLB)
Energy Select Sector SPDR (XLE)
Financial Select Sector SPDR (XLF)
Industrial Select Sector SPDR (XLI)
Technology Select Sector SPDR (XLK)
Consumer Staples Select Sector SPDR (XLP)
Utilities Select Sector SPDR (XLU)
Health Care Select Sector SPDR (XLV)
Consumer Discretionary Select SPDR (XLY)
Available data are so limited that sensitivity test results may mislead. With that reservation, we perform two robustness/sensitivity tests: (1) comparison of returns for all nine ranks of winner through loser based on a ranking interval of six months and a holding interval of one month (6-1); and, (2) comparison of winner returns for ranking intervals ranging from one to 12 months (1-1 through 12-1) and for a six-month lagged six-month ranking interval (12:7-1) per “Isolating the Decisive Momentum (Echo?)”, all with one-month holding intervals. Using monthly adjusted closing prices for the sector ETFs and SPDR S&P 500 (SPY) over the period December 1998 through December 2015 (205 months), we find that:
All calculations assume that monthly reallocation/rebalancing occurs at the close on the last trading day of each month (assuming that past returns for the ETFs can be calculated for ranking purposes just before the close).
The following chart shows average monthly 6-1 sector momentum strategy gross returns for rank 1 (highest momentum) through rank 9 (lowest momentum) since July 1999, with one standard deviation variability ranges. The chart also shows comparable statistics for an equally weighted, monthly rebalanced (EW) portfolio of the nine sectors as a simple benchmark (representing the value of diversification) and for SPY. Notable points are:
- Rank 1 has an above average return, and the difference in average returns between ranks 1 and 9 is positive.
- Average returns do not decline systematically from rank 1 through rank 9. Rank 6 has the lowest average return, and rank 5 has the highest. Ranks 7 and 8 have relatively high average returns.
Results do not compellingly support belief in sector momentum strategy effectiveness.
What happens for ranking intervals other than six months?
![]()
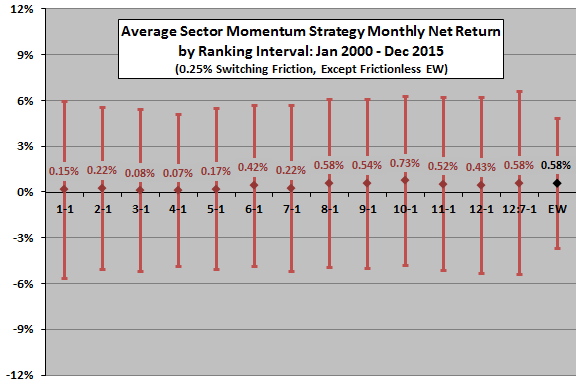
The next chart shows average monthly net returns for sector momentum strategies 1-1 through 12-1 and 12:7-1 since January 2000 (allowing a 12-month return calculation). The assumed level of trading (switching) friction is 0.25% of the balance for all ranking intervals. Monthly EW portfolio rebalancing is frictionless for conservative benchmarking. Results suggest that:
- A ranking interval of ten months is optimal over the available sample period. A six-month ranking interval is above the average across ranking intervals.
- While longer ranking intervals generally outperform shorter ones, the seven-month interval does not work well.
- Variation across ranking intervals is not systematic, undermining belief in a stable best choice.
The available sample period is short for confident inference. The best ranking intervals may be lucky rather than fundamentally meaningful.
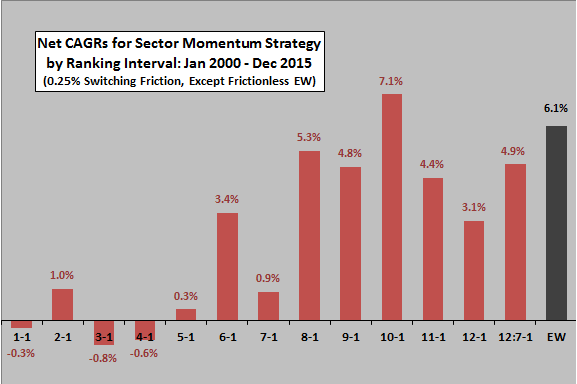
For another perspective, we look at compound annual growth rates (CAGR) across ranking intervals.
The final chart summarizes CAGRs for sector momentum strategies 1-1 through 12-1 and 12:7-1 since December 1999. Results confirm that a ranking interval ten months works best over the sample period. However, 10-1 only modestly beats the frictionless EW benchmark portfolio, which is much less volatile. At the assumed level of trading friction, three ranking intervals lose money.
In summary, evidence from momentum rank and ranking interval sensitivity tests for a limited sample offer little support for belief in simple sector ETF momentum strategy effectiveness.
Cautions regarding findings include:
- The performance of the best (worst) ranking/ranking interval incorporates data snooping bias and therefore likely overstates (understates) expected performance.
- As noted, sample sizes (only 34 independent six-month ranking intervals in the first test and 17 independent 12-month ranking intervals in the second test) are very small for confident inference.
- The method/parameters derive from research on individual stocks. While arguable that the findings should carry over to ETFs, there might be confounding effects. For example, hedging practices (using a sector ETF to hedge positions in individual stocks from the sector) might affect translation of an anomaly from individual stocks to ETFs.