Market Models
The CXO Advisory Group LLC offers this summary of projections from the Reversion-to-Value (RTV) Model and the Real Earnings Yield (REY) Model of the U.S. stock market as alternative ways of thinking about current equity valuation.
The RTV Model hypothesizes that the forward aggregate earnings yield for equities relates positively to future stock market returns. From the model description: the RTV Model appears to offer perhaps a little information about S&P 500 Index returns over the next few quarters, but it is not very reliable.
The REY Model hypothesizes that the gap between the forward aggregate earnings yield for equities and the forward total inflation rate relates positively to future stock market returns. From the model description: the REY Model appears to offer some information about S&P 500 Index returns over the next few quarters.
Both models depend on a purely technical Earnings Forecast based on hypotheses that the aggregate corporate operating earnings growth rate exhibits: (1) short-term momentum/acceleration; and, (2) long-term reversion related to degree of deviation from trend.
The REY Model depends also on a purely technical Inflation Forecast based on hypotheses of both persistence and momentum in the inflation rate.
Per analyses in “Comparing Lagged and Forward RTV and REY Models”, the summary includes projections from two variations in the REY Model, one using the gap between the lagged aggregate earnings yield and the lagged total inflation rate (REY-L) and the other using the gap between the forward aggregate earnings yield and the lagged total inflation rate (REY-M). For clarity, we use RTV-F and REY-F to designate model versions using only forward estimates. These models/variations cover a range of beliefs about the best way to anticipate earnings and inflation.
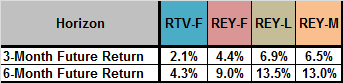
The following table summarizes returns for the three and six months from the end of February 2015, as projected by the RTV-F, REY-F, REY-L and REY-M Models.
Why focus on 3-month and 6-month forecast horizons?
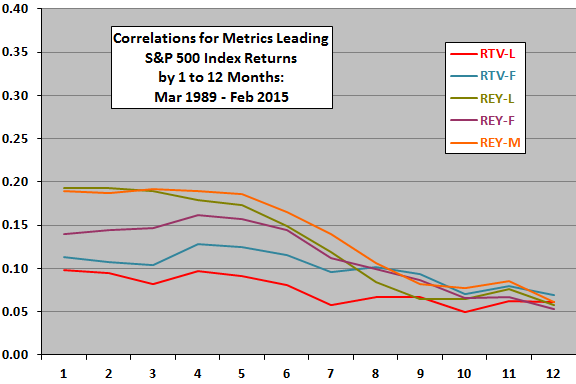
We focus on intermediate-term (3-month and 6-month) forecast horizons because the leading relationship between these metrics and stock market behavior is generally strongest over intermediate horizons. The following chart illustrates by plotting correlations between each metric measured at monthly intervals and monthly (not cumulative) S&P 500 Index returns for leading relationships of one to 12 months.
Moreover, while correlations between the metrics and cumulative future stock market returns may be fairly high, the available sample is short for considering long-term horizons.
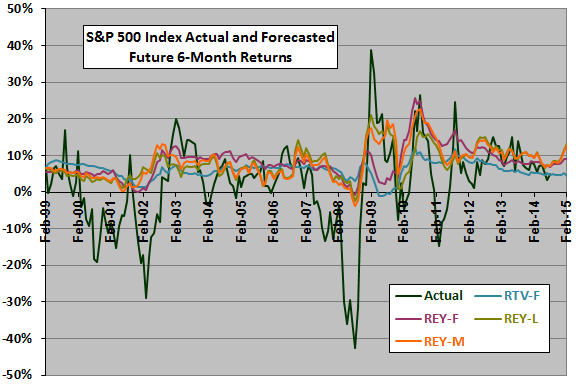
How well do the models perform at an intermediate-term forecast horizon?
The next chart summarizes a backtest of 6-month future return forecasts since February 1999 (allowing a minimum of 10 years of data for forecast regressions). The chart shows that linear extrapolation is an imprecise tool as applied to these models, with the forecasts exhibiting some tendencies to anticipate actual good and bad market returns but missing a lot of the actual volatility.
Is there a way to take into account non-linearities in the relationships between the selected metrics and future stock market returns?
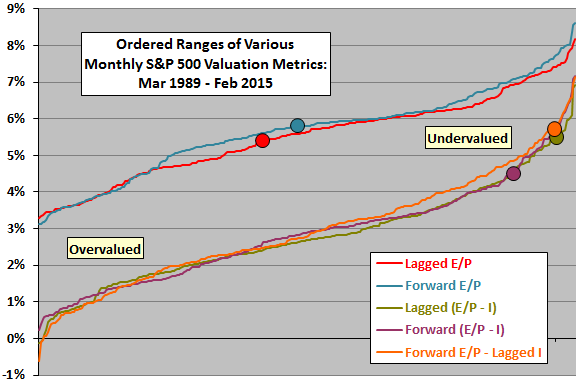
The next chart is an S&P 500 valuation map that shows the values of five S&P 500 valuation metrics plotted monthly in order from lowest to highest values over the indicated sample period, as follows:
- Lagged E/P = S&P 500 actual operating earnings over the past 12 months divided by the level of the S&P 500 Index.
- Forward E/P = S&P 500 forecasted operating earnings over the next 12 months divided by the level of the S&P 500 Index (corresponding to the RTV Model).
- Lagged (E/P – I) = S&P 500 actual operating earnings over the past 12 months minus actual total inflation rate over the past 12 months, divided by the level of the S&P 500 Index.
- Forward (E/P – I) = S&P 500 forecasted operating earnings over the next 12 months minus forecasted total inflation rate over the next 12 months, divided by the level of the S&P 500 Index (corresponding to the REY Model).
- Forward E/P – Lagged I = S&P 500 forecasted operating earnings over the next 12 months minus actual total inflation rate over the past 12 months, divided by the level of the S&P 500 Index (corresponding to the REY-A Model).
Circles matched by color show the values of the five metrics based on current data. This approach provides perspective on extremities in relationships but does not quantify outlooks. The quintile breakdowns of future returns in the RTV Model and REY Model descriptions offer a third perspective on forecasting usefulness, but the available samples are very small for such breakdowns.
Note also the following additional sources of uncertainty and potential inaccuracy in the models, as stated in the detailed model descriptions:
- Investors may employ methods of estimating forward earnings and forward inflation rate that differ materially from the Earnings Forecast and Inflation Forecast used in the models.
- The U.S. stock market is not a closed system. Other, substantially uncorrelated asset classes may compete.
- Decision factors other than the ones used in the models may be important to investors.
- There may be considerable randomness in market behavior.
- Consideration of multiple models increases the probability of discovering “lucky” results.
- The samples used in some aspects of development of the models are small for the tests employed, and overlap of measurement intervals may distort statistics.
- The relationships between S&P 500 Index future returns and the key metrics of the models found for the development sample periods may not persist as investors adapt to known relationships.
- Non-normality of the stock market returns disrupts interpretation of the “normal” statistics used in the models.
Changes:
11/30/09: Extended the regressions and rolled the projections by one month.
12/31/09: Extended the regressions and rolled the projections by one month.
1/29/10: Made a moderate revision to the Earnings Forecast model (mostly to simplify calculations for momentum and reversion), incorporated (a little early) the actual Standard & Poor’s earnings results for the fourth quarter of 2009, and extended regressions and rolled the projections by one month. The Earnings Forecast (rather than the Inflation Forecast) is driving projections, with both earnings momentum strongly positive and earnings reversion positive.
2/26/10: Extended the regressions and rolled the projections by one month.
3/31/10: Extended the regressions and rolled the projections by one month. The combination of a forecasted earnings rebound and low lagged and forecasted inflation indicates strong market appreciation.
5/1/10: Incorporated the actual Standard & Poor’s earnings results for the first quarter of 2010, and extended the regressions and rolled the projections by one month. The Earnings Forecast (rather than the Inflation Forecast) is driving projections, with earnings momentum strongly positive and earnings reversion positive but approaching neutrality.
5/28/10: Extended the regressions and rolled the projections by one month.
6/30/10: Extended the regressions and rolled the projections by one month.
8/2/10: Incorporated estimated Standard & Poor’s earnings results for the second quarter of 2010 (upward revision likely), and extended the regressions and rolled the projections by one month. The Earnings Forecast (rather than the Inflation Forecast) is driving projections, with earnings momentum positive and earnings reversion slightly positive.
8/30/10: Extended the regressions and rolled the projections by one month (one day early to accommodate travel schedule; will adjust after Labor Day).
10/1/10: Updated the backtest chart and the market valuation metrics map above.
10/16/10: Extended the regressions and rolled the projections by one month. Introduced a new REY Model variation and relabeled models/variations.
11/4/10: Incorporated estimated Standard & Poor’s earnings results for the third quarter of 2010 (revision likely), and extended the regressions and rolled the projections by one month. The Earnings Forecast (rather than the Inflation Forecast) is driving projections, with earnings momentum positive and earnings reversion slightly positive. Also updated the backtest chart and the market valuation metrics map above.
11/30/10: Extended the regressions and rolled the projections by one month. Updated the backtest chart and the market valuation metrics map above.
12/31/10: Extended the regressions and rolled the projections by one month. Discarded the 12-month projection because the predictive value of the metrics falls off beyond a six-month horizon. Updated the backtest chart and the market valuation metrics map above.
1/31/11: Extended the regressions and rolled the projections by one month. Updated the backtest chart and the market valuation metrics map above.
2/28/11: Incorporated estimated Standard & Poor’s earnings results for the fourth quarter of 2010 (revision likely), and extended the regressions and rolled the projections by one month. Updated the backtest chart and the market valuation metrics map above.
3/31/11: Extended the regressions and rolled the projections by one month. Updated the backtest chart and the market valuation metrics map above.
5/1/11: Incorporated estimated Standard & Poor’s earnings results for the first quarter of 2011 (revision likely), and extended the regressions and rolled the projections by one month. Updated the backtest chart and the market valuation metrics map above.
5/31/11: Extended the regressions and rolled the projections by one month. Updated the backtest chart and the market valuation metrics map above.
6/30/11: Extended the regressions and rolled the projections by one month. Updated the backtest chart and the market valuation metrics map above.
7/29/11: Incorporated estimated Standard & Poor’s earnings results for the second quarter of 2011 (revision likely), and extended the regressions and rolled the projections by one month. Updated the backtest chart and the market valuation metrics map above.
8/31/11: Extended the regressions and rolled the projections by one month. Updated the backtest chart and the market valuation metrics map above.
9/30/11: Extended the regressions and rolled the projections by one month. Updated the backtest chart and the market valuation metrics map above.
10/31/11: Incorporated estimated Standard & Poor’s earnings results for the third quarter of 2011 (revision likely), and extended the regressions and rolled the projections by one month. Updated the backtest chart and the market valuation metrics map above.
11/30/11: Extended the regressions and rolled the projections by one month. Updated the backtest chart and the market valuation metrics map above.
12/30/11: Extended the regressions and rolled the projections by one month. Updated the backtest chart and the market valuation metrics map above.
1/31/12: Incorporated estimated Standard & Poor’s earnings results for the fourth quarter of 2011 (revision likely), and extended the regressions and rolled the projections by one month. Updated the backtest chart and the market valuation metrics map above.
2/29/12: Extended the regressions and rolled the projections by one month. Updated the backtest chart and the market valuation metrics map above.
3/30/12: Extended the regressions and rolled the projections by one month. Updated the backtest chart and the market valuation metrics map above.
4/30/12: Incorporated estimated Standard & Poor’s earnings results for the first quarter of 2012 (revision likely), and extended the regressions and rolled the projections by one month. Updated the backtest chart and the market valuation metrics map above.
5/31/12: Extended the regressions and rolled the projections by one month. Updated the backtest chart and the market valuation metrics map above.
6/29/12: Extended the regressions and rolled the projections by one month. Updated the backtest chart and the market valuation metrics map above.
7/31/12: Incorporated estimated Standard & Poor’s earnings results for the second quarter of 2012 (revision likely), and extended the regressions and rolled the projections by one month. Updated the backtest chart and the market valuation metrics map above.
8/31/12: Extended the regressions and rolled the projections by one month. Updated the backtest chart and the market valuation metrics map above.
9/28/12: Extended the regressions and rolled the projections by one month. Updated the backtest chart and the market valuation metrics map above.
10/31/12: Incorporated estimated Standard & Poor’s earnings results for the third quarter of 2012 (revision likely), and extended the regressions and rolled the projections by one month. Updated the backtest chart and the market valuation metrics map above.
11/30/12: Extended the regressions and rolled the projections by one month. Updated the backtest chart and the market valuation metrics map above.
12/31/12: Extended the regressions and rolled the projections by one month. Updated the backtest chart and the market valuation metrics map above.
1/31/13: Incorporated estimated Standard & Poor’s earnings results for the fourth quarter of 2012 (revision likely), and extended the regressions and rolled the projections by one month. Updated the backtest chart and the market valuation metrics map above.
2/28/13: Extended the regressions and rolled the projections by one month. Updated the backtest chart and the market valuation metrics map above.
3/28/13: Extended the regressions and rolled the projections by one month. Updated the backtest chart and the market valuation metrics map above.
4/30/13: Incorporated estimated Standard & Poor’s earnings results for the first quarter of 2013 (revision likely), and extended the regressions and rolled the projections by one month. Updated the backtest chart and the market valuation metrics map above.
5/31/13: Extended the regressions and rolled the projections by one month. Updated the backtest chart and the market valuation metrics map above.
6/28/13: Extended the regressions and rolled the projections by one month. Updated the backtest chart and the market valuation metrics map above.
7/31/13: Incorporated estimated Standard & Poor’s earnings results for the second quarter of 2013 (revision likely), and extended the regressions and rolled the projections by one month. Updated the backtest chart and the market valuation metrics map above.
8/30/13: Extended the regressions and rolled the projections by one month. Updated the backtest chart and the market valuation metrics map above.
9/30/13: Extended the regressions and rolled the projections by one month. Updated the backtest chart and the market valuation metrics map above.
10/31/13: Incorporated estimated Standard & Poor’s earnings results for the third quarter of 2013 (revision likely), and extended the regressions and rolled the projections by one month. Updated the backtest chart and the market valuation metrics map above.
11/29/13: Extended the regressions and rolled the projections by one month. Updated the backtest chart and the market valuation metrics map above.
12/31/13: Extended the regressions and rolled the projections by one month. Updated the backtest chart and the market valuation metrics map above.
1/31/14: Incorporated estimated Standard & Poor’s earnings results for the fourth quarter of 2013 (revision likely), and extended the regressions and rolled the projections by one month. Updated the backtest chart and the market valuation metrics map above.
2/28/14: Extended the regressions and rolled the projections by one month. Updated the backtest chart and the market valuation metrics map above.
3/31/14: Extended the regressions and rolled the projections by one month. Updated the backtest chart and the market valuation metrics map above.
4/30/14: Incorporated estimated Standard & Poor’s earnings results for the first quarter of 2014 (revision likely), and extended the regressions and rolled the projections by one month. Updated the backtest chart and the market valuation metrics map above.
5/30/14: Extended the regressions and rolled the projections by one month. Updated the backtest chart and the market valuation metrics map above.
6/30/14: Extended the regressions and rolled the projections by one month. Updated the backtest chart and the market valuation metrics map above.
7/31/14: Incorporated estimated Standard & Poor’s earnings results for the second quarter of 2014 (revision likely), and extended the regressions and rolled the projections by one month. Updated the backtest chart and the market valuation metrics map above.
8/29/14: Extended the regressions and rolled the projections by one month. Updated the backtest chart and the market valuation metrics map above.
9/30/14: Extended the regressions and rolled the projections by one month. Updated the backtest chart and the market valuation metrics map above.
10/31/14: Incorporated estimated Standard & Poor’s earnings results for the third quarter of 2014 (revision likely), and extended the regressions and rolled the projections by one month. Updated the backtest chart and the market valuation metrics map above.
11/28/14: Extended the regressions and rolled the projections by one month. Updated the backtest chart and the market valuation metrics map above.
12/31/14: Extended the regressions and rolled the projections by one month. Updated the backtest chart and the market valuation metrics map above.
1/30/15: Incorporated estimated Standard & Poor’s earnings results for the fourth quarter of 2014 (data immature and revision very likely), and extended the regressions and rolled the projections by one month. Updated the backtest chart and the market valuation metrics map above.
2/27/15: Extended the regressions and rolled the projections by one month. Updated the backtest chart and the market valuation metrics map above.
See also “How Well Do the REY/RTV Models Catch Turning Points?” and “Valuation Metric Map and Critique” for additional discussion on usefulness of the models.
Please see the disclaimer.