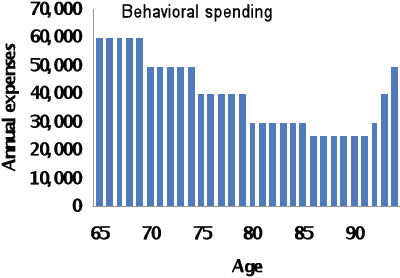
What is the best way to deploy assets for retirement? In his September 2009 paper entitled “Life is Non-linear: Structuring Retirement Portfolios for the Long Haul”, Joachim Klement analyzes six common retirement portfolio strategies in terms of their longevity and income generation over a retiree’s expected lifetime. The study emphasizes that income requirements vary during retirement, first declining with age and then accelerating near the end of life. The study applies Monte Carlo simulation based on the following assumptions: annual rebalancing of assets to strategic portfolio weights; total annual fees of 1% of portfolio value; inflation rate of 3%; 15% tax rate on portfolio cash flow; normal distributions of annual returns with means (standard deviations) of 9.4% (15%) for stocks and 5.3% (5.4%) for bonds; and, correlation between stock and bond returns of 0.20. Using this model, he concludes that:
The six alternative retirement asset allocations examined are:
- Benchmark: 40% U.S. large-cap stocks and 60% U.S. Treasury bonds.
- Smoothed consumption: the benchmark allocation with constant, inflation-adjusted spending (unlike the chart below).
- Delayed retirement: the benchmark allocation with retirement delayed by two years.
- Stacked portfolio: next five years of cash flow covered by nearly risk-free assets (e.g. certificates of deposit) and the balance 60% in U.S. large-cap stocks and 40% in U.S. Treasury bonds.
- Fixed annuity and growth portfolio: roughly half of initial allocation in an inflation-adjusted, fixed annuity and the balance 60% in U.S. large-cap stocks and 40% in U.S. Treasury bonds.
- Variable annuity and growth portfolio: same as fixed annuity allocation, but with a variable rather than fixed annuity.
Principal findings are:
- Portfolios #4, #5 and #6 increase retirement income and reduce the risk of portfolio exhaustion compared to #1, #2 and #3.
- Portfolios that include annuities are least likely to exhaust funds, but sacrifice potential wealth creation in rising markets, have higher fees and carry the unquantified risk of default by the seller of the annuity. Risk-averse retirees should probably opt for partial annuitization (#5 or #6), accepting a somewhat lower spending allowance and a smaller estate at end of life.
- Portfolios #4, #5 and #6 are relatively insensitive, in terms of risk of exhaustion, to tax rates above 15% compared to portfolios #1, #2 and #3.
The following chart, taken from the paper, is the non-linear retirement spending profile assumed for all allocations in the study except #2, in constant 2008 dollars. The profile assumes a high level of spending in the earlier years of retirement as individuals fulfill long-held dreams. Over time, activity declines and cash-flow needs diminish accordingly. Then, in the last years of life, cash needs accelerate due to medical expenses.

In summary, retirees may be able to achieve both higher spending allowances and lower probabilities of portfolio exhaustion by allocating part of their portfolios to a safe core and the balance to a growth-tilted stocks-bonds mix.
Assumptions of the normality of asset return distributions, a constant inflation rate and a constant stocks-bonds correlation arguably detract from the degree to which the study’s results are realistic.