Is a “Rip Van Winkle” asset allocation strategy, wherein an investor gradually migrates from stocks to fixed income in pre-specified steps, optimum? Or, is there some simple, less passive alternative that takes equity bull and bear markets into account? In their November 2008 paper entitled “Dynamic Lifecycle Strategies for Target Date Retirement Funds”, Anup Basu, Alistair Byrne and Michael Drew question the rationale for pre-determined lifecycle equity/fixed income rebalancing and compare it to an alternative 40-year dynamic lifecycle strategy that flexibly rebalances depending on success to date. The dynamic strategy holds 100% stocks for the first 20 or 30 years and then annually switches partially to fixed income or remains 100% in stocks depending on whether or not it is achieving a target 10% annualized rate of return. The authors include 100% stocks and static balanced 60/30/10 stocks/bonds/cash strategies as benchmarks. Using bootstrapping to augment a dataset of annual nominal returns for U.S. stocks, bonds and bills spanning 1900-2004 (105 years), they conclude that:
- The dynamic lifecycle strategy generally outperforms the pre-determined lifecycle strategy. For example:
- The dynamic strategy outperforms the pre-determined strategy in 75 -80% of cases, with higher mean and median wealth outcomes.
- The only cases for which the pre-determined strategy beats the dynamic strategy are those in the bottom 5% of wealth outcomes.
- The mean wealth outcome for 100% stocks is higher than that for both the pre-determined and dynamic lifecycle strategies. The median wealth outcome for 100% stocks is is higher than that for the pre-determined lifecycle strategy but lower than that for the dynamic lifecycle strategy, suggesting that the dynamic lifecycle strategy offer better protection from bad outcomes.
- The static balanced fund has lower mean and median wealth outcomes than all three other strategies.
- Setting the target annualized rate or return for dynamic reallocation is an important consideration. If set too high (low), the strategy becomes like a 100% stocks (pre-determined lifecycle) strategy. Simulations indicate that target annualized rates of return from 8% to 12% are effective.
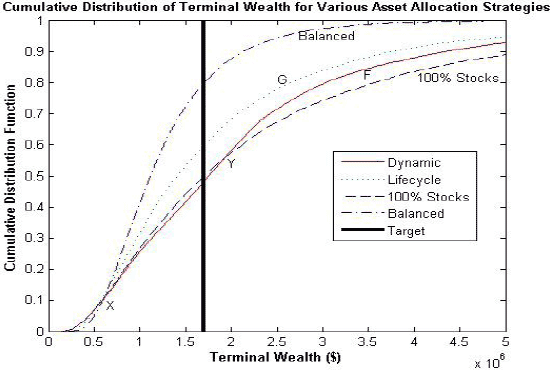
The following chart, taken from the paper, compares the distributions of wealth outcomes over 40-year periods during 1900-2004 for identical retirement savings streams into four competing strategies:
- A dynamic lifecycle strategy that is 100% stocks for the first 30 years and then reallocates annually between equities and fixed income according to whether it has achieved a target 10% annualized rate of return to date (“Dynamic”), as derived from the “Target” terminal wealth.
- A pre-determined lifecycle strategy that is 100% stocks for the first 30 years and then shifts annually in prescribed steps away from equities and toward fixed income (“Lifecycle”).
- A constant 100% allocation to stocks (“100% Stocks”).
- A constant 60/30/10 stocks/bonds/bills allocation, rebalanced annually (“Balanced”).
In general, curves that are lower on the chart indicate superior wealth outcome distributions. The “Dynamic” strategy beats the “Lifecycle” strategy in most cases and beats the “100% Stocks” strategy in a significant fraction of cases. The “Balanced” strategy offers the least desirable distribution of outcomes.

In summary, lifecycle investors will generally achieve greater terminal wealth using interim success-based dynamic stocks/fixed income allocation rules than using pre-determined shifts away from stocks and toward fixed income.