
Is firm total asset growth rate an independently valuable indicator of future stock returns? In their January 2009 paper entitled “The Asset Growth Effect in Stock Returns”, Michael Cooper, Huseyin Gulen and Michael Schill review the evidence for a strong asset growth effect in U.S. stock returns unexplained by other widely cited effects. Using firm fundamentals and stock return data for all non-financial U.S. public companies over the period 1968-2007, they conclude that:
- During 1968-2007, based on an equal weighting of stocks:
- A hedge portfolio rebalanced annually that is long (short) the stocks of companies with the lowest (highest) percentage growth in total assets over the previous 12 months generates an average annual return of 22% before trading frictions.
- On a risk-adjusted basis (market, size and book-to-market), this hedge portfolio generates an average monthly alpha of 1.1%.
- Low asset growth stocks outperform high asset growth stocks during 90% of calendar years.
- Over five-year holding periods, low asset growth stocks beat high asset growth stocks by an average cumulative return difference of 91%.
- This asset growth effect is stronger for small capitalization stocks, but is still substantial for large capitalization stocks.
- The effect is strongest in the month of January.
- Asset growth rate retains large explanatory power for future stock returns after accounting for firm size, book-to-market ratio and momentum. In fact the asset growth effect is at least as powerful in explaining returns as these other widely used factors.
The following chart, taken from the paper, shows the average monthly return from five years before to five years after portfolio formation for ten equally weighted portfolios formed at the end of each June during 1968-2006 from ten total asset growth deciles. The asset growth rate is the change in total assets over the most recently completed two fiscal years. There is a clear reversal in returns about six months before the time of sorting, such that high (low) asset growth firms with high (low) past returns tend to generate low (high) future returns. This reversal in returns is monotonic across asset growth rate deciles and approximately symmetrical.
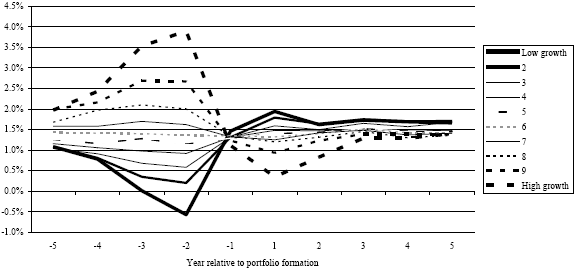
In summary, evidence indicates that past firm total asset growth is a strong indicator of future stock returns, with low (high) asset growth indicating high (low) future returns. This asset growth effect is largely separate from size, value and momentum effects.
Cautions regarding findings include:
- Reported returns are gross, not net. Incorporating reasonable trading frictions from annual portfolio rebalancing and stock borrowing costs for the short side would reduce indicator performance. Shorting may not be feasible for all stocks in the short side.
- Calculating aggregate asset growth for a large sample of stocks and holding enough stocks for reliable exploitation may be problematic for investors, or costly if delegated.
Frequently Asked Questions
What is the asset growth effect in stock returns?
The asset growth effect is the tendency of stocks of companies with low percentage growth in total assets to outperform stocks of companies with high asset growth. In the study of all non-financial U.S. public companies over 1968-2007, past firm total asset growth was a strong indicator of future returns, with low (high) asset growth indicating high (low) future returns.
Does asset growth predict future stock returns?
Yes, asset growth predicted future stock returns in the 1968-2007 study of non-financial U.S. public companies. An equal-weighted hedge portfolio, long the lowest and short the highest asset growth stocks and rebalanced annually, earned an average 22% per year before trading frictions. Low asset growth stocks beat high asset growth stocks in 90% of calendar years.
How is the asset growth hedge portfolio constructed and tested?
The asset growth hedge portfolio is formed by ranking non-financial U.S. public companies on percentage growth in total assets, then going long the lowest-growth stocks and short the highest-growth stocks with annual rebalancing and equal weighting. Performance over 1968-2007 was also assessed on a risk-adjusted basis (market, size and book-to-market), yielding an average monthly alpha of 1.1%. The study also formed ten asset growth deciles each June and tracked returns from five years before to five years after formation.
Is the asset growth effect the same as the size, value or momentum effect?
No, the asset growth effect is largely separate from the size, value and momentum effects. Asset growth retained large explanatory power for future stock returns after accounting for firm size, book-to-market ratio and momentum, and was at least as powerful as these factors in explaining returns. The effect is stronger for small capitalization stocks but still substantial for large capitalization stocks.
What are the limitations of using asset growth to pick stocks?
The reported 22% average annual return for the asset growth hedge portfolio is gross, so trading frictions from annual rebalancing and stock borrowing costs on the short side would reduce performance. Shorting may not be feasible for all stocks on the short side. Calculating asset growth for a large sample and holding enough stocks for reliable exploitation may also be problematic for investors, or costly if delegated.