
Are there market conditions most conducive to stock pairs trading? In their March 2012 paper entitled “Losing Sight of the Trees for the Forest? Pairs Trading and Attention Shifts”, Heiko Jacobs and Martin Weber assess how big-picture turbulence relates to profitability of stock pairs trading, hypothesizing that big-picture distractions draw attention away from specific opportunities. Their measure of big-picture distraction is daily regression-based aggregate unexpected returns for 49 U.S. industry portfolios, ranked (in-sample) into distraction deciles for each year. Their pairs trading approach involves each month: (1) selecting the 100 U.S. common stock pairs (out of 200 million possible) with the least divergence over the past 12 months; (2) over the next six months, entering equal long-short positions in any of these 100 pairs when normalized prices diverge by more than two historical standard deviations; and, (3) exiting pair positions when prices re-converge, or after one month if they do not re-converge. A selected pair may trade several times during its six-month active period. They consider trading with and without a one-day delay after signals. Using daily prices for reasonably large (above median market capitalization) and liquid NYSE/AMEX common stocks during 1960 through 2008, and similar data for eight other major international stock markets from the mid-1990s through 2009, they find that:
- The big-picture distraction measure reasonably peaks on October 20, 1987, March 15, 2000 and September 17, 2001.
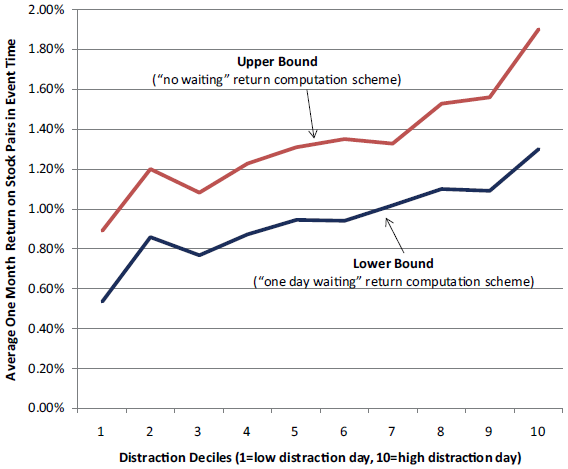
- Pairs trading is about twice as profitable on high-distraction days compared to low-distraction days (see the chart below). Enhanced profitability derives from:
- A roughly 20% greater likelihood of pair re-convergence.
- A roughly 10% higher average return on re-convergence (but no difference in average return for failure to re-converge).
- Accordingly, pair trades:
- Opened immediately before holidays (especially Christmas and New Year’s Day) tend to be more likely to re-converge and more profitable.
- Involving stocks from the same industry tend to be less affected by big-picture distraction.
- Involving stocks more (less) covered by the media tend to be less (more) profitable and less (more) affected by big-picture distraction.
- Findings generally persist, but may be somewhat weaker, for calculation of big-picture distraction decile ranks out-of-sample based on a rolling history of 250 trading days (such as a trader could implement).
- The distraction effect is persistent over time and robust to other measures of big-picture turbulence, and to adjustment for market return, size, book-to-market ratio and short-term reversal factors. Measures of market liquidity, such as the S&P 500 implied volatility index (VIX) and the spread between three-month LIBOR and the three-month Treasury bill yield (TED spread), partly explain the effect.
- The distraction effect is evident to varying degrees in all eight non-U.S. stock markets.
The following chart, taken from the paper, illustrates the effect of distraction on average gross one-month profitability of over 100,000 round-trip U.S. stock long-short pair trades during 1962 through 2008. After opening upon divergence, pair trades close upon re-convergence (and go to cash) or close after one month. The red (blue) line shows results with no delay (a one-day delay) between divergence/re-convergence signals and trades.
In general, gross profitability increases with level of big-picture distraction on the day of pair divergence (based on in-sample decile rank), such that decile 10 trades are roughly twice as profitable as decile 1 trades. The cost of waiting a day to execute is considerable across deciles.
Note that returns are trade-level, not portfolio-level. Pair trade opportunities may cluster, such that the portfolio sometimes carries a large cash reserve.
In summary, evidence indicates that stock pairs trading may be substantially more profitable if initiated when the overall market is exceptionally turbulent.
Cautions regarding findings include:
- Reported returns are gross, not net. Including reasonable estimates of trading frictions, which are relatively high during much of the sample period, and costs of shorting would reduce returns. As suggested by the interaction of the distraction effect with VIX, trading frictions may tend to be relatively high on high-distraction days due to wide bid-ask spreads.
- As noted, allocation of capital to specific pair trades may be problematic due to clustering of signals, such that a material fraction of the portfolio is a cash reserve during dry spells, thereby limiting portfolio-level return.
- Cost of data acquisition and processing may be material, thereby reducing overall profitability.
- As noted in the study, reported returns derive from in-sample decile rankings. An out-of-sample (implementable) approach may inherently reduce returns and introduce delay in signal implementation.
Some simpler measure of daily big-picture distraction may add value to stock pairs trading derived from less intensive pair search.
Frequently Asked Questions
What is stock pairs trading and how does it generate profit?
Stock pairs trading is a strategy that takes equal long and short positions in two historically similar stocks when their normalized prices diverge, expecting them to re-converge. In the studied approach, a pair is entered when prices diverge by more than two historical standard deviations and exited upon re-convergence, or after one month if no re-convergence occurs.
Does market turbulence make pairs trading more profitable?
Yes, pairs trading is about twice as profitable on high-distraction (turbulent) days as on low-distraction days, based on over 100,000 U.S. stock pair trades during 1962-2008. The gain comes from a roughly 20% greater likelihood of pair re-convergence and a roughly 10% higher average return upon re-convergence. The effect appears to varying degrees in all eight non-U.S. markets studied and persists after adjusting for market, size, book-to-market and short-term reversal factors.
How is market distraction measured and used to test pairs trading profitability?
Big-picture distraction is measured using daily regression-based aggregate unexpected returns for 49 U.S. industry portfolios, ranked in-sample into distraction deciles for each year. Each month, the 100 pairs with the least divergence over the prior 12 months are selected, and positions are opened during the next six months when normalized prices diverge by more than two standard deviations. Profitability is then compared across distraction deciles, with and without a one-day execution delay.
Do pairs trades in same-industry or heavily media-covered stocks respond differently to market distraction?
Pairs involving stocks from the same industry tend to be less affected by big-picture distraction. Pairs of stocks with more media coverage tend to be less profitable and less affected by distraction, while less-covered stocks tend to be more profitable and more affected. Trades opened just before holidays, especially Christmas and New Year's Day, also tend to re-converge more often and be more profitable.
What are the limitations of the distraction-based pairs trading findings?
The reported pairs trading returns are gross, so trading frictions and shorting costs would reduce them, and frictions may be higher on high-distraction days because of wide bid-ask spreads. The decile rankings are in-sample, and out-of-sample versions may be somewhat weaker and delay signals, while a one-day execution delay considerably cuts profitability. Returns are also trade-level rather than portfolio-level, since clustered signals can leave a large cash reserve, and data acquisition and processing costs may be material.