
Does purifying stock returns (by using only the parts of returns unexplained by the Fama-French market, size and value factors) improve momentum strategy performance? Does avoiding extreme losers that may sharply reverse further enhance performance? In their November 2012 paper entitled “Some Simple Tricks to Boost Price Momentum Performance”, Andrew Lapthorne, Rui Antunes, John Carson, Georgios Oikonomou, Charles Malafosse and Michael Suen investigate the effects on stock momentum strategy performance of:
- Ranking stocks on cumulative lagged residual (idiosyncratic) rather than raw total return, with residual return calculated monthly as that unexplained by one-factor (market) or three-factor (plus size and book-to-market ratio) models based on 36-month lagged rolling regressions, and alternatively adjusting residual returns for each stock by dividing by their volatilities.
- Avoiding distressed stocks that may be about to recover sharply, with distress measured as the percentage by which a stock’s current price is below its rolling lagged 12-month high.
They define momentum strategy performance as the return on a portfolio that is each month long (short) the tenth of stocks with the highest (lowest) cumulative residual returns over the past 12 months, with a skip-month between ranking interval and portfolio formation month. Using total returns in U.S. dollars and other data for FTSE World Index stocks, and contemporaneous regional Fama-French model factors, during June 1993 through September 2012, they find that:
- Regarding effects of momentum purification:
- Compared to a conventional momentum strategy implemented with raw total stock returns, using stock returns residual of the market return more than doubles momentum strategy average gross annualized return, while cutting volatility by almost half and maximum drawdown by more than half (gross annual Sharpe ratio 0.69 versus 0.05 for a conventional strategy). Dividing market-residual stock returns by their volatilities further boosts gross annual Sharpe ratio to 0.84.
- Using stock returns residual of all three Fama-French model factors modestly reduces momentum strategy maximum drawdown compared to market-residual results, but generates slightly lower gross annual Sharpe ratios.
- Regarding avoidance of distressed stocks likely to reverse (that would appear in the short side of a conventional momentum portfolio):
- Compared to a conventional momentum strategy, excluding stocks that are at least 50% below their respective 12-month highs more than doubles momentum strategy average gross annualized return, while cutting volatility by about a third and maximum drawdown by more than half (gross annual Sharpe ratio 0.55 versus 0.05 for a conventional strategy).
- Improvement derives largely from limiting momentum strategy drawdowns during strong market rebounds from lows.
- Changing the screening criterion to exclude fewer stocks (stocks priced 60%, 70%, 80% or 90% below their 12-month highs) materially reduces enhancement from distress avoidance.
- Combining residual momentum with distress avoidance further enhances momentum strategy performance (see the chart below). For example, the Sharpe ratio based on market-residual returns and exclusion of stocks that are at least 50% below their 12-month highs is 1.51, compared to 0.55 for and 0.69 for the respective standalone enhancements.
- Results are generally robust by world geographic region.
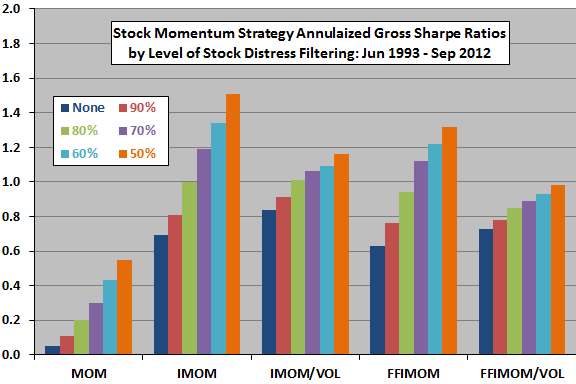
The following chart, constructed from data in the paper, compares gross annual Sharpe ratios for the following five stock momentum strategy implementations, each with six distress avoidance levels based on percentage of stocks below their respective 12-month highs:
- MOM: conventional momentum strategy based on lagged 12-month raw total returns in U.S. dollars, with a skip month between ranking interval and monthly portfolio formation.
- IMOM: similar momentum strategy based on returns residual (idiosyncratic) from the market return based on monthly rolling 36-month historical regressions (stock returns unexplained by market betas).
- IMOM/VOL: IMOM calculated with residual returns divided by respective volatilities over the ranking interval.
- FFIMOM: similar momentum strategy based on returns residual from all three Fama-French model factors based on monthly rolling 36-month historical regressions (stock returns unexplained by market betas, sizes and book-to-market ratios).
- FFIMOM/VOL: FFIMOM calculated with residual returns divided by respective volatilities over the ranking interval.
Results show that residual return momentum strategies dramatically outperform a conventional momentum strategy, and that excluding distressed stocks progressively improves all momentum strategies as the number of stocks excluded increases. Using all three Fama-French factors to calculate residual returns is not clearly better than using only the market return. Adjusting stock returns with their volatilities is not clearly worthwhile.
In summary, evidence indicates that investors may be able to enhance hedged stock momentum strategy performance by focusing on residual (idiosyncratic) stock returns and excluding stocks trading far below their 12-month highs.
Cautions regarding findings include:
- Reported returns are apparently all gross, ignoring trading frictions and costs/feasibility of shorting. It is possible that the enhancement methods increase portfolio turnover and therefore elevate trading frictions, such that findings based on net performance may differ.
- Testing many strategy variations on the same sample introduces data snooping bias, such that the best performing variation likely overstates out-of-sample results. Data snooping bias may also derive from parameter selections such as length of ranking interval and length of regression interval.
- Executing the enhancement methods presented may not be “simple” for many investors, or may otherwise be costly if delegated.
- Avoiding distressed stocks does not apply to a long-only momentum strategy.
For research on applying residual returns to exploit short-term reversal (the complement of avoiding distressed stocks in the short side of a hedged momentum portfolio), see “Purified Short-term Stock Reversal”. See also “Exploiting Momentum While Avoiding Long-term Reversal” for another approach to identifying stocks about to reverse.
Frequently Asked Questions
What is residual (idiosyncratic) momentum in stock investing?
Residual momentum is a stock momentum strategy that ranks stocks on the part of their past returns unexplained by market-wide factors, rather than on raw total returns. In the study, residual return is calculated monthly using 36-month rolling regressions on the market return (one-factor) or on the market, size and book-to-market factors (three-factor). The strategy goes long the top decile and short the bottom decile of stocks by cumulative residual return over the past 12 months, with a skip month before portfolio formation.
Does residual momentum outperform conventional price momentum?
Residual momentum outperformed conventional momentum in a study of FTSE World Index stocks from June 1993 to September 2012. Using market-residual returns more than doubled average gross annualized return, cut volatility by almost half and maximum drawdown by more than half, with a gross annual Sharpe ratio of 0.69 versus 0.05 for conventional momentum. These results are gross of trading costs and may be affected by data snooping.
How do you avoid momentum crashes by excluding distressed stocks?
Avoiding momentum crashes in this study involves excluding stocks whose current price is far below their rolling lagged 12-month high, since such distressed stocks in the short side may rebound sharply. Excluding stocks at least 50% below their 12-month highs raised the gross annual Sharpe ratio to 0.55 versus 0.05 for conventional momentum, mainly by limiting drawdowns during strong market rebounds from lows. Using looser screens (60% to 90% below highs) materially reduced the benefit.
Is a three-factor Fama-French residual momentum strategy better than a market-only residual momentum strategy?
A three-factor Fama-French residual momentum strategy is not clearly better than one using only market-residual returns. Removing market, size and value effects modestly reduced maximum drawdown but produced slightly lower gross annual Sharpe ratios than the market-residual version (0.69). Dividing residual returns by volatility raised the market-residual Sharpe ratio to 0.84, but the study found that volatility adjustment is not clearly worthwhile.
What are the limitations of improving momentum strategies with residual returns and distress avoidance?
The reported momentum improvements are apparently gross of trading frictions, shorting costs and feasibility, and the enhancements may raise portfolio turnover so net results could differ. Testing many strategy variations on one sample introduces data snooping bias, as can choices such as the ranking and regression interval lengths, so the best results likely overstate out-of-sample performance. Distress avoidance also does not apply to long-only momentum strategies, and the methods may not be simple or cheap to implement.